Charting a corrective bounce, S&P 500 vies to extend rally from major support (4,230)
Focus: Dow industrials challenge 200-day average from underneath
Technically speaking, the U.S. benchmarks have staged a corrective bounce to start the fourth quarter amid a still bearish-leaning bigger-picture backdrop.
On a headline basis, the S&P 500 and Nasdaq Composite have recently asserted intermediate-term downtrends, while the Dow Jones Industrial Average remains capped by its marquee 200-day moving average.
Editor’s Note: As always, updates can be directly accessed at https://chartingmarkets.substack.com.
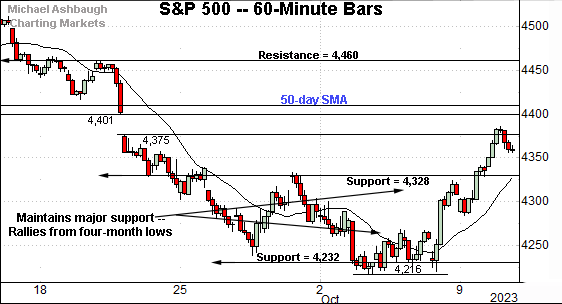
Before detailing the U.S. markets’ wider view, the S&P 500’s hourly chart highlights the past four weeks.
As illustrated, the S&P 500 has rallied from four-month lows.
On further strength, gap resistance (4,401) is closely followed by the 50-day moving average, currently 4,410. As always, the 50-day moving average is a widely-tracked intermediate-term trending indicator.
Conversely, notable support matches the 4,330 area. More broadly, the prevailing upturn originates from the 4,230 area, matching major support detailed on the daily chart.
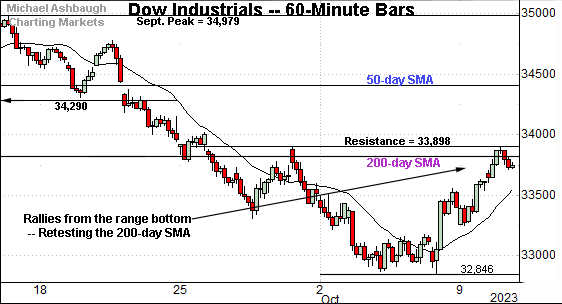
Meanwhile, the Dow Jones Industrial Average has rallied to a headline technical test.
Specifically, the Dow is retesting its 200-day moving average, currently 33,812, a widely-tracked longer-term trending indicator.
The 200-day is closely followed by the 33,900 area, matching a three-week range top.
Against this backdrop, the Nasdaq Composite has also reversed from four-month lows.
Tactically, the initial retest of the 50-day moving average, currently 13,608 remains underway.
Conversely, the 13,360 area matches gap support, detailed previously.
(On a granular note, the Nasdaq’s prevailing upturn has filled the late-September gap, outpacing the S&P 500.)
Widening the view to six months adds perspective.
On this wider view, the Nasdaq has asserted a bearish intermediate-term bias.
To start, the index remains positioned under its 50-day moving average, a widely-tracked intermediate-term trending indicator.
Separately, the Nasdaq has registered a series of “lower highs” and “lower lows” also consistent with a downtrend.
Tactically, eventual follow-through atop the 50-day moving average, currently 13,608, and the more distant 13,860 resistance would strengthen the bull case.
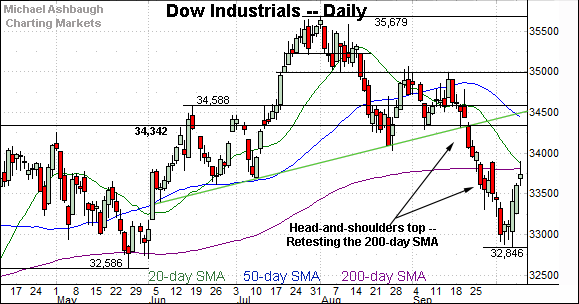
Looking elsewhere, the Dow Jones Industrial Average has asserted a bearish longer-term bias.
Tactically, recall the September downdraft punctuated a head-and-shoulders top defined by the June, August and September peaks.
The index subsequently violated its 200-day moving average, currently 33,812, a widely-tracked longer-term trending indicator.
More immediately, the Dow’s initial retest of the 200-day — from underneath — is currently underway. Eventual follow-through higher — which is not an assured outcome, based on today’s backdrop — would signal waning bearish momentum.
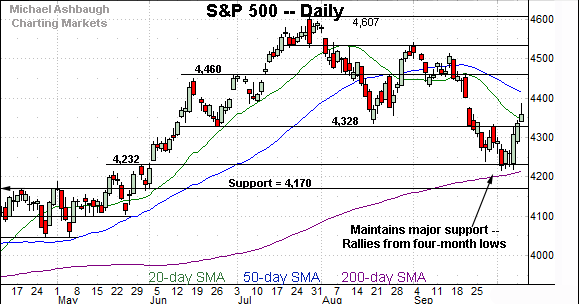
Meanwhile, the S&P 500 has weathered a notable technical test.
Specifically, the S&P has maintained major support — the 4,232 area — detailed previously. The October closing low (4,229) registered within three points.
Delving slightly deeper, the 200-day moving average, currently 4,216, is rising toward support.
The bigger picture
As detailed above, the U.S. benchmarks’ bigger-picture backdrop remains bearish-leaning on balance.
On a headline basis, the S&P 500 and Nasdaq Composite have asserted an intermediate-term downtrend — a series of “lower highs” and “lower lows” — capped by the 50-day moving average. (Separately, the slope of each benchmark’s 50-day moving average points lower, also signaling an intermediate-term downtrend.)
Meanwhile, the Dow Jones Industrial Average has violated its 200-day moving average, and thus far maintained a posture under this area.
The pending retest from underneath, of each area just detailed, should be a useful bull-bear gauge. The Nasdaq Composite and Dow industrials are currently pressing key trending indicators.
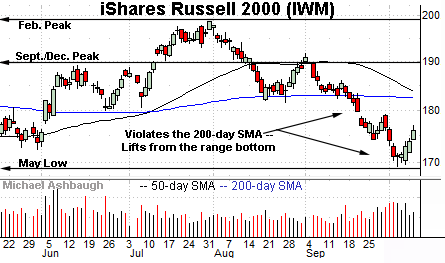
Moving to the small-caps, the iShares Russell 2000 ETF (IWM) is digesting the September downdraft.
The prevailing upturn has been punctuated by decreased relative volume, and originates from support matching the May low.
More broadly, recall the September downturn punctuated a head-and-shoulders top defined by the June, July and September peaks.
Tactically, the pattern’s neckline tracks the 200-day moving average, currently 182.75. Eventual follow-through atop the 200-day would place the small-cap benchmark on firmer technical ground.
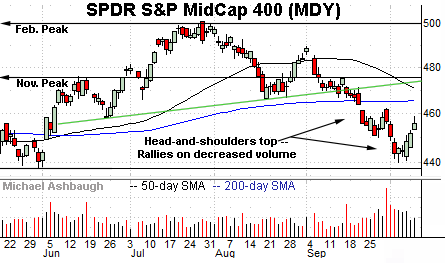
Similarly, the SPDR S&P MidCap 400 ETF (MDY) is consolidating a September downdraft.
Here again, the prevailing upturn has registered as lukewarm, fueled by decreased volume.
Tactically, major resistance rests in the 462.50-to-465.60 area, the latter matching the 200-day moving average. Sustained follow-through atop this area would place the brakes on bearish momentum.
Returning to the S&P 500, the index has survived a headline technical test.
Specifically, the S&P has maintained the 4,216-to-4,232 area, levels matching the 200-day moving average and major support.
The October low (4,216) and the October closing low (4,229) have registered nearby. (Also see the hourly chart.)
Still, the initial rally from major support — as measured by volume, breadth and price action — gets mixed marks for style at best. At least based on today’s backdrop.
Against this backdrop, the S&P 500’s bearish intermediate-term bias is intact. Eventual follow-through atop gap resistance (4,400) and the more important 4,460 area — detailed repeatedly — would strengthen the bull case.
More broadly, the S&P 500’s longer-term bias remains bullish to the extent the index continues to maintain its 200-day moving average. But to reiterate, the S&P’s October rally from the 200-day has not screamed “raging bull.”
As always, it’s not just what the markets do, it’s how they do it. The September downdraft registered as technically aggressive, and has been punctuated by a thus far comparably lackluster rally attempt.


