Charting (another) bearish technical tilt, Nasdaq violates 200-day average
Focus: 10-year yield clears 200-week average for first time since 2019, Russell 2000 violates major support
Technically speaking, January selling pressure has accelerated in recent sessions, inflicting material damage to the major U.S. benchmarks.
Against this backdrop, the Nasdaq Composite has placed distance firmly under its 200-day moving average — by as much as a 2.7% margin — while the S&P 500 has failed consecutive tests of notable resistance. Each benchmark has asserted a bearish intermediate-term bias, based on today’s backdrop.
Editor’s Note: As always, updates can be directly accessed at https://chartingmarkets.substack.com. (Experimenting with a new layout on the Charting Markets main page.)
Before detailing the U.S. markets’ wider view, the S&P 500’s hourly chart highlights the past four weeks.
As illustrated, the S&P has extended to one-month lows.
The downturn at least briefly placed the index under major support (4,545) an area also detailed on the daily chart.
(On a granular note, consider that last week’s close (4,663) matched major resistance (4,664) — detailed previously — while the week-to-date peak (4,632) has also matched familiar resistance (4,632). Bearish price action, against the current backdrop.)
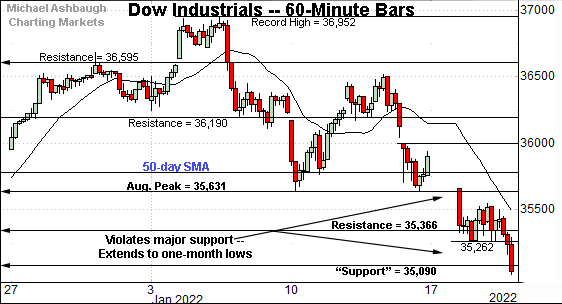
Similarly, the Dow Jones Industrial Average has extended to one-month lows.
The prevailing downturn punctuates a violation of major support (35,631), an area also illustrated on the daily chart.
Tactically, consider that Monday’s close (35,368) matched familiar resistance (35,366), detailed previously.
On further strength, the breakdown point (35,630) marks more significant overhead.
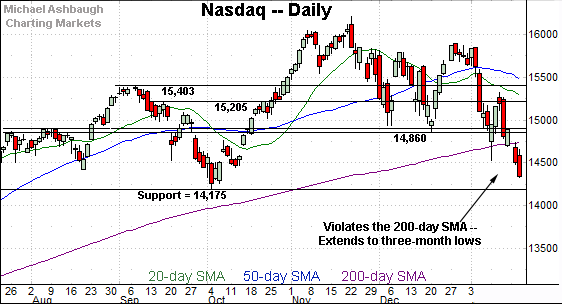
Perhaps not surprisingly, the Nasdaq Composite remains the weakest major benchmark.
As illustrated, the index has violated its 200-day moving average, currently 14,738, extending to three-month lows.
From current levels, initial resistance (14,530) is followed by the 200-day moving average, a level closely matching the week-to-date peak (14,740).
Widening the view to six months adds perspective.
On this wider view, the Nasdaq’s January downdraft has inflicted significant technical damage.
To start, the index has violated major support (14,860) punctuating a triple top defined by the November and December peaks.
Moreover, the index has placed distance under its 200-day moving average, currently 14,738, notching consecutive closes lower for the first time since April 2020.
As always, the 200-day moving average is a widely-tracked longer-term trending indicator. The index has closed 2.7% under its 200-day moving average, raising the flag to a primary trend shift.
More broadly, the Nasdaq has reached correction territory, closing 10% under its record close. (The January closing low (14,340) has registered 10.7% under the Nasdaq’s record close (16,057).)
Tactically, the week-to-date peak (14,740) matches the 200-day moving average (14,738) and is followed by major overhead at the breakdown point (14,860). The pending retests from underneath should be a useful bull-bear guage.
Based on today’s backdrop, the Nasdaq’s intermediate- to longer-term bias remains bearish pending a close atop the 14,860 area.
(On a granular note, the Nasdaq’s sentiment backdrop — as measured by the CBOE Nasdaq 100 Volatility Index (VXN) — remains stubbornly complacent despite this week’s damaging downdraft. By this measure, the Nasdaq still remains vulnerable to incremental downside, as detailed last week.)
Looking elsewhere, the Dow Jones Industrial Average remains relatively stronger than the Nasdaq.
But here again, its January downdraft has accelerated, inflicting technical damage.
Tactically, the Dow’s breakdown point (35,630) pivots to major resistance. A swift reversal higher would place the index on firmer technical ground. (Also see the hourly chart.)
Conversely, the marquee 200-day moving average, currently 34,962, is now firmly within view. The Dow’s week-to-date low (35,028) has registered just slightly higher.
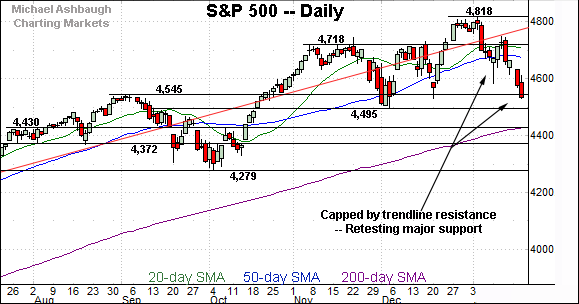
Meanwhile, the S&P 500 has also extended its January downdraft.
In the process, the index has placed distance under its 50-day moving average, currently 4,681, pulling in to major support (4,545) matching its breakout point.
The bigger picture
As detailed above, the January market downdraft has accelerated, inflicting broadly-based technical damage.
And as always, it’s not just what the markets do, it’s how they do it.
Though the major benchmarks are near-term oversold at current levels — and a corrective bounce seems to be underway early Thursday — each index has asserted a bearish intermediate-term bias, pending repairs.
Moving to the small-caps, the iShares Russell 2000 ETF has violated its range bottom.
This area marked major support — illustrated on the five-year chart — and opens the path to an air pocket, hinged to the massive late-2020 rally.
More broadly, the strong-volume downdraft punctuates a head-and-shoulders top, defined by the September, November and January peaks. As always, the head-and-shoulders top is a high-reliability bearish reversal pattern.
So collectively, the small-cap benchmark’s prevailing backdrop lays the groundwork for potentially material downside follow-through.
Tactically, initial resistance (208.75) is followed by the firmer breakdown point — the 210.70-to-211.10 area. A swift reversal higher would mark a step toward stabilization.
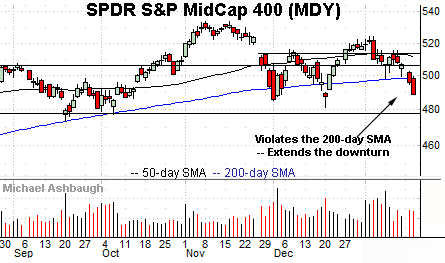
Meanwhile, the SPDR S&P MidCap 400 ETF remains comparably stronger.
As illustrated, the mid-cap benchmark has tagged just one-month lows, while the small-cap benchmark — the Russell 2000 — has registered one-year lows.
Still, the MDY has violated its 200-day moving average, currently 498.65. The prevailng downturn punctuates its first consecutive closes lower since September 2020.
Slightly more broadly, the prevailing downturn originates from the 50-day moving average and the November omicron-fueled gap. (The Russell 2000’s downturn also originates from the 50-day moving average, and the November gap.)
Returning to the S&P 500, this next chart is a weekly view, spanning 30 months. Each bar on the chart represents one week.
As illustrated, the S&P 500 is digesting a massive 13-month, 49% rally from the November 2020 low — (just before the U.S. election) — to the Jan. 4, 2022 peak.
Across this span, the S&P has registered just one close under its 20-week moving average, currently 4,584. (The final September 2021 weekly close registered narrowly lower, by about four points.)
This means the current weekly close will be worth tracking for a potential milestone following an unusually persistent 13-month uptrend.
At the January peak, roughly one third of the market’s total value had registered over just the prior 13 months. (Amid a pandemic?)
Placing a finer point on the S&P 500, the index has extended to tag one-month lows. The chart above is a one-month chart.
Against this backdrop, the week-to-date peak (4,632) matches familiar resistance (4,632) detailed repeatedly.
On further strength, last week’s close (4,663) matched next resistance (4,664) to punctuate a failed test from underneath.
Combined, the S&P’s consecutive failed retests from underneath — and subsequent downside follow-through — signal a bearish intermediate-term bias.
Returning to the S&P 500’s six-month view, bearish developments stand out.
To start, the 50-day moving average’s slope (in blue), currently 4,673, has ticked lower, consistent with an intermediate-term downtrend.
Separately, the S&P has registered a “lower closing low” versus the “mid-December closing low” also consistent with an intermediate-term downtrend.
Combine the price action with material damage elsewhere — most notably, on the Nasdaq Composite and Russell 2000 — and the S&P 500’s prevailing backdrop supports a bearish intermediate-term bias.
Tactically, a swift reveral atop major resistance (4,664) matching last week’s close (4,663) — which looks unlikely, based on today’s backdrop — would strengthen the bull case. (Also see the hourly chart.)
One stray note: 10-year yield clears 200-week average
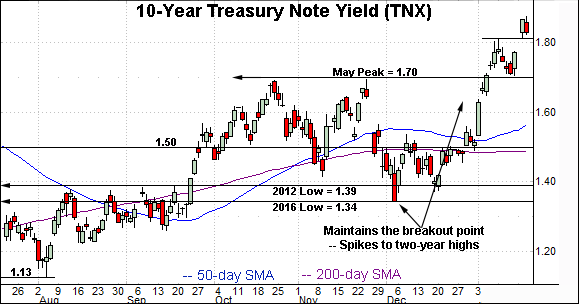
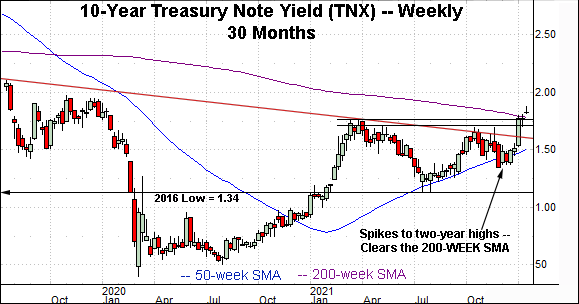
Concluding with a stray note, the 10-year Treasury note yield has started 2022 with a massive trendline breakout.
In the process, the yield has tagged two-year highs, clearing its 200-week moving average, currently 1.784.
The 10-year yield has not registered a weekly close atop the 200-week moving average since May 2019, a 32-month span.
So here again, Friday’s close is worth tracking for a potential milestone.
More broadly, the prevailing upturn originates from a headline inflection point matching the 2016 low (1.34). Recall this is the point from which the plunge to pandemic-zone territory originated. (See the Sept. 8 review, as the yield’s breakout was taking shape.)
Also recall the prevailing January surge resembles the strong 2021 start, a move that would ultimately span 75 basis points across about 10 weeks. (The current January upturn has spanned 34 basis points across three weeks.)
Editor’s Note: Wednesday’s review was held up by a Substack.com technology glitch. The next Charting Markets review will be published Monday.


