Bearish momentum accelerates, Nasdaq back for second crack at 200-day average
Focus: Small- and mid-cap benchmarks stage lackluster bounces from major support
Technically speaking, the major U.S. benchmarks continue to whipsaw amid a jagged 2022 start.
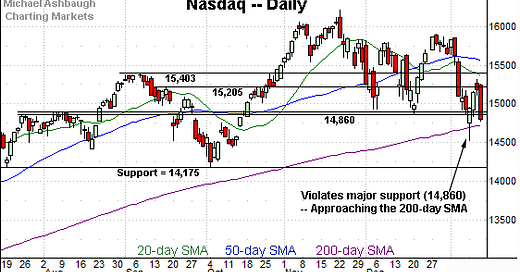
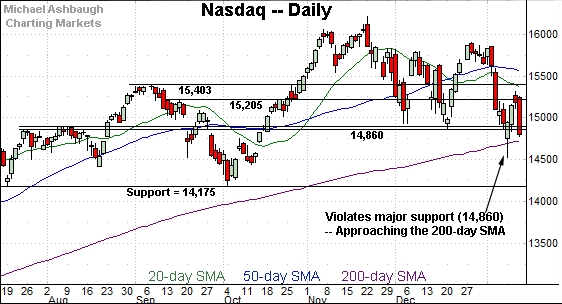
Amid the cross currents, the Nasdaq Composite has violated major support (14,860), placing its marquee 200-day moving average under siege.
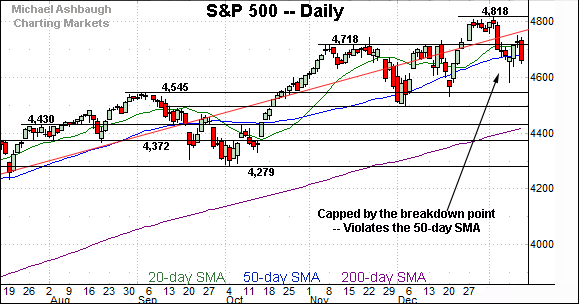
Elsewhere, the S&P 500 remains comparably resilient — amid a still bullish backdrop — though the index has violated notable near-term floors.
Editor’s Note: As always, updates can be directly accessed at chartingmarkets.substack.com.
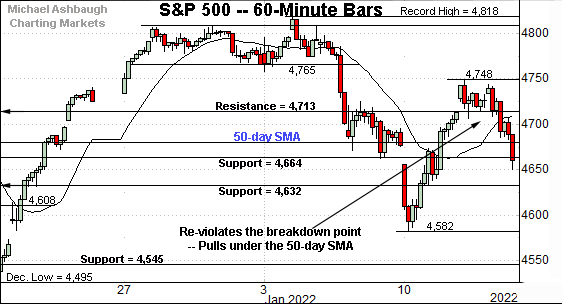
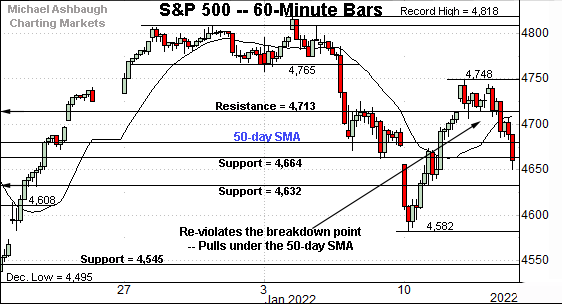
Before detailing the U.S. markets’ wider view, the S&P 500’s hourly chart highlights the past four weeks.
As illustrated, the S&P is off to a jagged January start.
The prevailing pullback places it back under the breakdown point (4,713) as well as the 50-day moving average, currently 4,681.
More immediately, a retest of slightly deeper support (4,664) remains underway.
Friday’s early session high (4,663) has registered nearby.
Meanwhile, the Dow Jones Industrial Average remains comparably stronger.
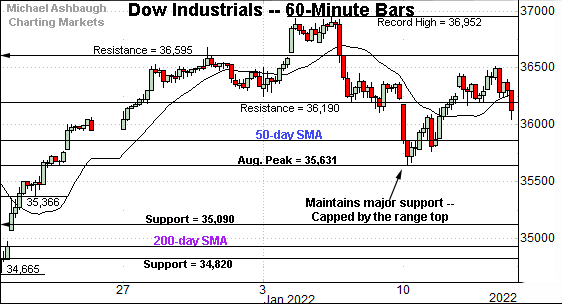
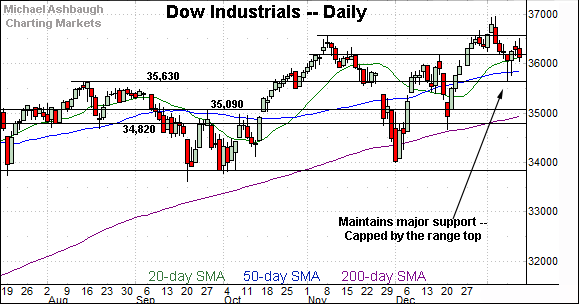
In fact, this is the only major U.S. benchmark currently positioned atop its 50-day moving average (35,832).
Delving deeper, the Dow has thus far maintained major support (35,631), an area better illustrated on the daily chart.
The week-to-date low (35,639) — also the January low — has registered nearby.
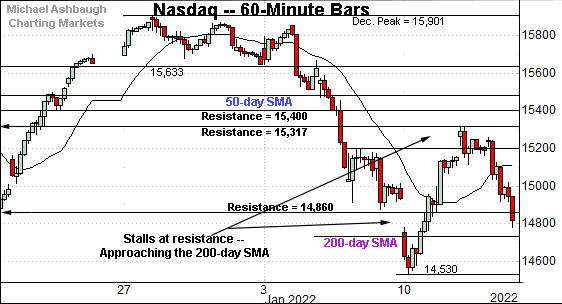
True to recent form, the Nasdaq Composite remains the weakest major benchmark.
As illustrated, the index has staged a lackluster rally from three-month lows, stalling at next resistance (15,317), detailed previously.
The week-to-date peak (15,319) has effectively matched resistance, and selling pressure has surfaced.
More immediately, the Nasdaq has violated major support (14,860), an area better illustrated below.
Widening the view to six months adds perspective.
On this wider view, the Nasdaq’s January downdraft has inflicted technical damage.
Thursday’s close (14,806) marked a three-month closing low, as well as the first closing violation of major support (14,860) since mid-October. (Recall support matches the December low (14,860) and July peak (14,863).)
Technically, the prevailing downturn punctuates a triple top, defined by the November and December peaks.
Perhaps more importantly, the marquee 200-day moving average, currently 14,725, is now firmly within view. As always, the 200-day moving average is a widely-tracked longer-term trending indicator.
The Nasdaq has not closed under its 200-day moving average since April 2020 — amid the pandemic-fueled market plunge — though another retest is underway early Friday.
Tactically, a closing violation of the 200-day would raise the flag to a potential primary trend shift.
Against this backdrop, recall the Nasdaq’s mid-week posture — detailed Wednesday — signaled an index vulnerable to incremental downside.
Since then, the Nasdaq’s sentiment backdrop — as measured by the CBOE Nasdaq 100 Volatility Index (VXN) — has improved just moderately. The index remains tenuously positioned, and still vulnerable to incremental downside, based on today’s backdrop.
Looking elsewhere, the Dow Jones Industrial Average remains the strongest major benchmark.
Recall the index started the week with a bullish reversal from major support (35,630).
The week-to-date low (35,639) — also the January low — roughly matched support to punctuate a successful retest.
From current levels, the 50-day moving average, currently 35,832, is followed by major support (35,630). A sustained posture atop this area signals a bullish intermediate-term bias.
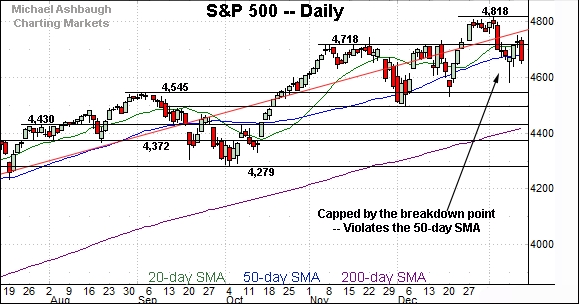
Meanwhile, the S&P 500 has registered less-than-stellar week-to-date price action.
To start, the early-week bullish reversal has been punctuated by a sluggish rally attempt, effectively capped by the breakdown point (4,718).
More immediately, the prevailing pullback places the S&P back under its 50-day moving average, currently 4,681, and punctuates a month-to-date closing low.
Beyond the details, the S&P 500’s bigger-picture backdrop remains constructive in the broad sweep. Recent consecutive failed tests of resistance from underneath, signal selling pressure worth tracking for potential acceleration.
The bigger picture
As detailed above, the major U.S. benchmarks remain in divergence mode.
Amid the cross currents, the S&P 500 and Dow industrials have retained a bullish intermediate-term bias.
Meanwhile, the Nasdaq Composite has asserted a bearish intermediate-term bias, and remains tenuously positioned. Tactically, its response to the 200-day moving average — and its breakdown point (14,860) — should be useful bull-bear gauges.
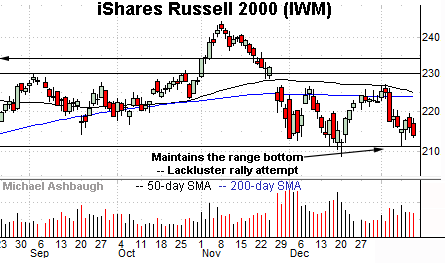
Moving to the small-caps, the iShares Russell 2000 ETF is not acting well technically.
Though the small-cap benchmark has maintained its range bottom — the 210.70-to-211.10 area — the subsequent rally attempt has been flat.
More broadly, the prevailing six-week range is capped by the 50-day moving average, a level matching the November omicron-fueled gap.
Also recall the developing head-and-shoulders top, defined by the September, November and January peaks.
Meanwhile, the SPDR S&P MidCap 400 ETF remains comparably stronger.
On a headline basis, the MDY has maintained its 200-day moving average, unlike the Russell 2000.
But here again, the prevailing rally from the 200-day has thus far been flat, and capped by the November gap.
Placing a finer point on the S&P 500, the index has whipsawed amid a jagged January start.
The prevailing pullback places it back under the breakdown point — the 4,713-to-4,718 area — as well as the 50-day moving average.
More immediately, the S&P has also ventured under deeper support (4,664).
Recall Friday’s early session high (4,663) has registered nearby.
Returning to the six-month view, the S&P 500’s intermediate-term bias remains bullish. Familiar inflection points stand out.
To start, the 50-day moving average, currently 4,681, is followed by the January low (4,582).
Delving deeper, likely last-ditch support continues to match the former breakout point (4,545). Tactically, an eventual closing violation this area would mark a material “lower low” likely raising a technical caution flag.
Footnote: Price action worth tracking
To the extent the S&P continues to draw selling pressure near former support — for instance, around the 4,713 and 4,664 areas — the price action would be worth tracking for potential downside acceleration.
Separately, a sustained Nasdaq rally atop the 14,860 area would mark a notable step toward stabilization.
No new setups today.

