Charting a May breakout, S&P 500 tags all-time highs
Focus: Small- and mid-caps lag behind amid pending breakout attempts
Technically speaking, the major U.S. benchmarks have broken out, rising amid recently market-friendly inflation data.
In the process, the S&P 500 and Nasdaq Composite have rallied to record territory, while the Dow Jones Industrial Average has narrowly registered all-time highs amid a breakout attempt that technically remains underway. The charts below add color:
Editor’s Note: As always, updates can be directly accessed at https://chartingmarkets.substack.com.
Before detailing the U.S. markets’ wider view, the S&P 500’s hourly chart highlights the past four weeks.
As illustrated, the S&P 500 has rallied to all-time highs.
The breakout places it atop major resistance (5,264) a level matching the March peak (5,264.85) and the April peak (5,263.95).
Slightly more broadly, recent follow-through builds on the early-May rally atop the 50-day moving average. Tactically, the 5,264 area pivots to support.
Meanwhile, the Dow Jones Industrial Average has also registered record highs.
Recent follow-through punctuates a bull flag, and builds on the early-May trendline breakout.
Against this backdrop, the Nasdaq Composite has also broken out.
Recent follow-through places it atop major resistance (16,538), a level matching the March peak (16,538) detailed on the daily chart below. This area pivots to notable support.
Widening the view to six months adds perspective.
On this wider view, the Nasdaq has broken out, reaching all-time highs.
The prevailing upturn builds on the early-May gap atop the 50-day moving average. This gap higher signaled a bullish shift in the Nasdaq’s intermediate-term bias.
On a granular note, consider that the bottom of the early-May gap (15,862) precisely matched the Nasdaq’s breakdown point (15,862), an area detailed repeatedly. (The May 2 peak.)
From current levels, the breakout point (16,538) marks first support, and is followed by a deeper floor in the 16,068-to-16,080 area. A violation of the latter would raise a caution flag.
Looking elsewhere, the Dow Jones Industrial Average has narrowly tagged a record high.
The prevailing upturn builds on the early-May gap atop the 20-day moving average, a move punctuated by persistent upside follow-through. Recall the trendline detailed on the hourly chart.
More broadly, the marquee 40,000 mark is firmly within view.
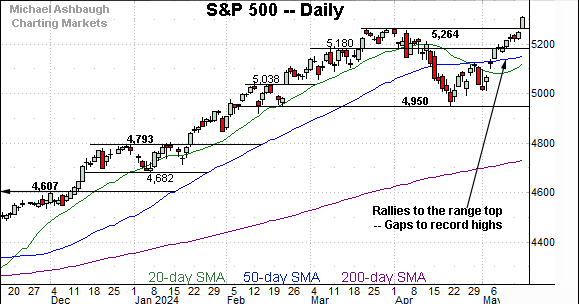
Meanwhile, the S&P 500 has rallied more decisively to record highs.
Tactically, the breakout point (5,264) pivots to notable support.
Consider that the top of the gap (5,263) — established this week — matches the breakout point (5,264), a level defined by the March and April peaks. (Also see the hourly chart.)
The bigger picture
As detailed above, the major U.S. benchmarks have broken out.
On a headline basis, the S&P 500 and Nasdaq Composite have rallied to record territory, while the Dow Jones Industrial Average has narrowly tagged all-time highs amid a breakout attempt that technically remains underway.
(As for the details, the Nasdaq Composite has staged a 1.2% breakout while the S&P 500 has registered a 0.9% breakout. Both moves confirm the primary uptrend.)
Moving to the small-caps, the iShares Russell 2000 ETF (IWM) has rallied to its range top, rising to challenge two-year highs.
Tactically, major resistance rests in the 2010.40-to-211.90 area. The pending retest from underneath should add color.
Slightly more broadly, the prevailing upturn originates from major support matching the Sept. peak (191.85).
Meanwhile, the SPDR S&P MidCap 400 ETF (MDY) is challenging all-time highs.
Tactically, resistance spans from 556.80 to 558.34, levels matching the April and March peaks respectively. The response to this area should be a useful bull-bear gauge.
As always, the chances of a breakout improve to the extent the MDY holds relatively tightly to resistance.
Returning to the S&P 500, this next chart is a weekly view spanning 30 months. Each bar on the chart represents one week.
As illustrated, the S&P has extended its uptrend, tagging yet another all-time high.
The prevailing upturn originates from the 20-week moving average, currently 5,060, a level that underpinned the index across three straight weeks.
More broadly, recent follow-through builds on the massive five-month rally from the Oct. 27 low (4,103) to the Mar. 28 peak (5,264). Recall that move spanned 1,161 points or 28.2%.
Based on today’s backdrop, an intermediate-term target projects from the April low to 5,575.
Narrowing to the S&P 500’s six-month view, the index has confirmed its primary uptrend.
Tactically, the breakout point (5,264) marks major support, a level matching the March peak (5,264.85) and the April peak (5,263.95), as well as the top of this week’s gap (5,263.26).
Delving deeper, the 50-day moving average, currently 5,154, remains an inflection point. A swift reversal under this area — which currently looks unlikely — would raise an intermediate-term caution flag.
Beyond technical levels, the prevailing breakout has been directionally sharp — marking a nearly 1.0% rally atop the March peak — amid broadening sector participation. Bullish price action.
Still, the underlying internal strength has registered mixed marks for style, at best.
All told, the S&P 500’s technical trends point higher in the wake of a seasonally unusual May breakout. An eventual violation of the 50-day moving average, and the 5,180 area, would raise a technical question mark.
Also see May 2: Charting a corrective bounce, S&P 500 nails 50-day average.


