Charting a bull flag, S&P 500 sustains Q2 breakout
Focus: Europe tags 52-week high, Energy Sector's trendline breakout, IEV, XLE, XLF, ORCL
Technically speaking, the major U.S. benchmarks have asserted a holding pattern, treading water to start April and the second quarter.
Nonetheless, boring is bullish — or at least bullish-leaning — against the prevailing technical backdrop. The response to the April earnings reports will likely add color.
Editor’s Note: As always, updates can be directly accessed at https://chartingmarkets.substack.com.
Before detailing the U.S. markets’ wider view, the S&P 500’s hourly chart highlights the past four weeks.
As illustrated, the S&P 500 is digesting the late-March breakout.
Tactically, near-term support (4,070) is followed by the deeper 50-day moving average, currently 4,032.
Separately, the 4,100 mark bisects the April range, an area also detailed on the daily chart.
Meanwhile, the Dow Jones Industrial Average has strengthened versus the other benchmarks.
The relatively tight April range has been punctuated by a modest breakout.
From current levels, the breakout point (33,634) is followed by a firmer floor at 33,420, also detailed on the daily chart.
Against this backdrop, the Nasdaq Composite has asserted a holding pattern.
Tactically, the April low (11,898) underpins a relatively tight range.
More broadly, each big three benchmark has thus far sustained the late-March spike atop the 50-day moving average.
Widening the view to six months adds perspective.
On this wider view, the Nasdaq has thus far stalled just under major resistance (12,270). Recall the seven-month range top is defined by the Sept. peak (12,270) and Feb. peak (12,269).
Nonetheless, the selling pressure near resistance has thus far been muted. The shallow pullback lays the groundwork for a potential breakout as the April earnings season unfolds.
Tactically, an eventual violation of the 50-day moving average, currently 11,754, would raise a caution flag.
Looking elsewhere, the Dow Jones Industrial Average has extended its rally attempt.
In the process, the index has reclaimed its former breakdown point (33,420), and reestablished this area as support.
Slightly more broadly, the prevailing flag pattern — the tight April range — is hinged to the steep late-March rally. Tactically, the prevailing rally attempt is intact barring a violation of the 50-day moving average, currently 33,110.
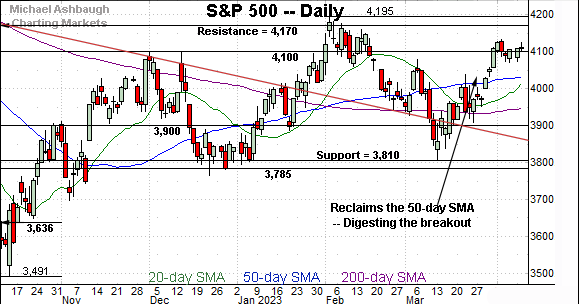
Similarly, the S&P 500 has asserted an April flag.
The bullish pattern is hinged to the 4,100 mark, an area also illustrated on the hourly chart.
The bigger picture
As detailed above, the major U.S. benchmarks have asserted an April holding pattern.
Broadly speaking, each big three benchmark reclaimed its 50-day moving average to conclude March, and has subsequently flatlined amid constructive price action.
Moving to the small-caps, the iShares Russell 2000 ETF (IWM) remains range-bound.
Tactically, the index has maintained major support, an area matching the Dec. low (170.34).
Nonetheless, the prevailing rally attempt remains sluggish, and has been capped by the 200-day moving average, currently 181.05. Eventual downside follow-through remains a prospect based on today’s backdrop.
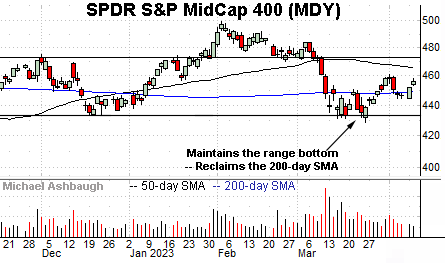
Similarly, the SPDR S&P MidCap 400 ETF (MDY) has registered a sluggish rally attempt, rising from major support.
Amid the upturn, the mid-cap benchmark has whipsawed at its 200-day moving average, currently 449.40.
More broadly, recall the developing head-and-shoulders top defined by the December, February and April peaks.
Returning to the S&P 500, the index is acting well enough technically.
The prevailing rally originates from major support (3,810) and has been punctuated by an April flag pattern, hinged to the 4,100 mark.
From current levels, near-term support (4,070) is followed by the deeper 50-day moving average, currently 4,032. A sustained posture atop the 50-day signals a bullish intermediate-term bias.
More broadly, the S&P 3,945 area remains a bull-bear fulcrum matching two familiar inflection points:
The 200-day moving average, currently 3,947.
The mid-point of the former range (3,942).
As always, it’s not just what the markets do, it’s how they do it. But generally speaking, the prevailing recovery attempt gets the benefit of the doubt barring a violation of the S&P 3,945 area.
Editor’s Note: The next review will be published Tuesday, April 18.
Watch List
Drilling down further, the iShares Europe ETF (IEV) is acting well technically.
As illustrated, the shares started the second quarter with a slight breakout, edging to 52-week highs. The subsequent flag pattern signals muted selling pressure, positioning the shares to build on the late-March rally.
Tactically, the breakout point (50.35) is followed by gap support (49.20) closely matching the 50-day moving average. The prevailing rally attempt is intact barring a violation.
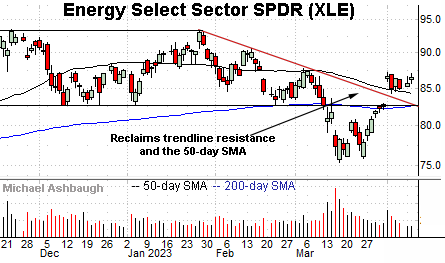
Moving to U.S. sectors, the Energy Select Sector SPDR (XLE) has come to life technically.
As illustrated, the group started the second quarter with a breakout, gapping atop trendline resistance and the 50-day moving average. The subsequent pullback has been comparably flat, fueled by decreased volume, laying the groundwork for potential upside follow-through.
Tactically, the prevailing range bottom (84.25) is followed by trendline support matching the 200-day moving average. The group’s recovery attempt is intact barring a violation.
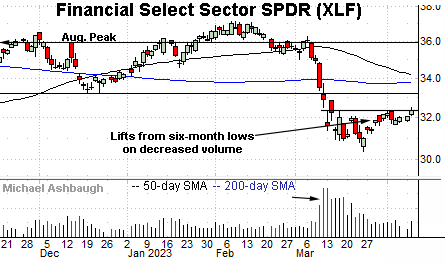
Meanwhile, the Financial Select Sector SPDR (XLF) is digesting the March downdraft. The flattish April start has been fueled by sluggish volume, preserving a bearish bias pending repairs.
Tactically, the post-breakdown peak (32.34) remains the group’s first hurdle, as detailed last month. (See the March 23 review.)
Tuesday’s close (32.34) precisely matched resistance amid a retest that remains in play.
On further strength, the breakdown point (33.20) marks firmer resistance. Eventual upside follow-through would strengthen the group’s backdrop.
Finally, Oracle Corp. (ORCL) is a well positioned large-cap name.
Late last month, the shares knifed to 15-month highs, clearing well-defined resistance. The subsequent pullback has been flat, placing the shares 2.2% under the April peak.
Tactically, the breakout point (90.70) pivots to well-defined support. The prevailing rally attempt is intact barring a violation.


