
Charting a slow-motion breakout attempt, S&P 500 edges to 3-month high
Focus: Nasdaq Composite and S&P 500 rally from major support

Technically speaking, the S&P 500 and Nasdaq Composite have narrowly tagged three-month highs, rising from successful tests of major support.
Against this bullish backdrop, an early-June breakout attempt remains underway. The charts below add color:
Editor’s Note: As always, updates can be directly accessed at chartingmarkets.substack.com.
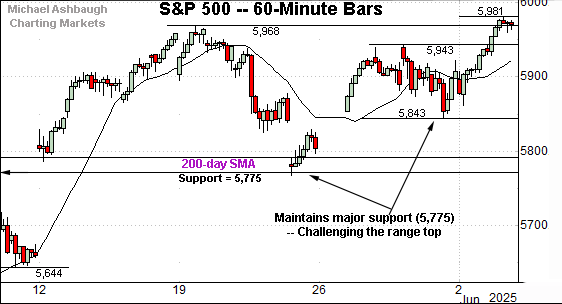
Before detailing the U.S. markets’ wider view, the S&P 500’s hourly chart highlights the past four weeks.
As illustrated, the S&P 500 has edged to three-month highs.
The prevailing upturn punctuates a nearly one-month range underpinned by major support (5,775). (Also see the daily chart.)
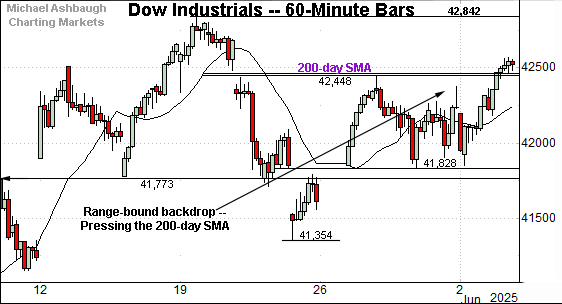
Meanwhile, the Dow Jones Industrial Average remains range-bound.
Within the range, the blue-chip benchmark is pressing its 200-day moving average, currently 42,440, a widely-tracked longer-term trending indicator.
The index has ventured slightly atop the 200-day to start June.
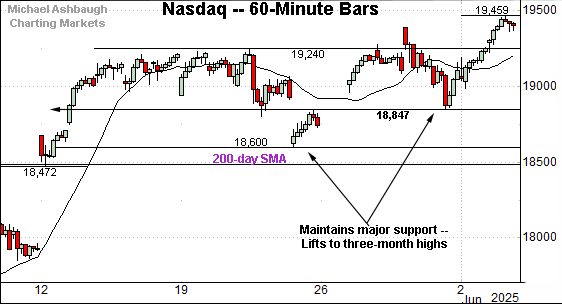
Against this backdrop, the Nasdaq Composite has rallied to three-month highs.
Like the S&P 500, the Nasdaq’s slight breakout punctuates a nearly one-month range, underpinned by the 200-day moving average.
More immediately, the prevailing upturn punctuates a successful test of major support (18,830) an area better illustrated on the daily chart below.
Beyond specific levels, the Nasdaq’s orderly one-month range — punctuated by upside follow-through to start June — signals a bullish backdrop.
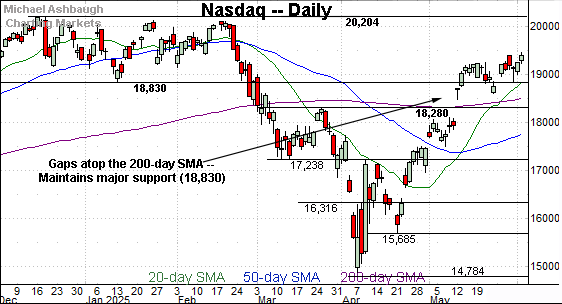
Widening the view to six months adds perspective.
On this wider view, the Nasdaq is acting well technically.
Recall the index knifed atop its 200-day moving average amid an early-May breakout.
More immediately, the Nasdaq has subsequently stabilized within its early-2025 range. In fact, the early-June upturn originates from major support (18,830), an area defining the former range bottom.
More broadly, the prevailing flag-like pattern — the three-week range, hinged to the massive rally off the April low — is a continuation pattern, improving the chances of upside follow-through. (Three weeks might be considered too long for a true flag pattern, but the general idea still holds.)
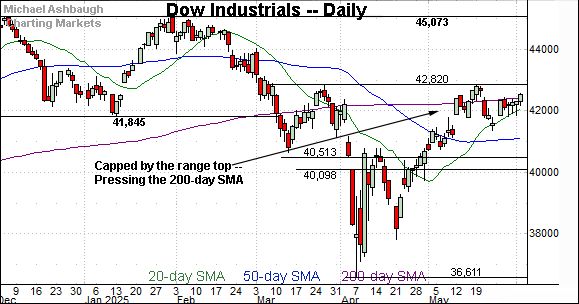
Looking elsewhere, the Dow Jones Industrial Average continues to lag behind the other benchmarks. The index has not registered multi-month highs.
Nonetheless, the Dow has held tightly to its 200-day moving average, an area closely followed by the range top (42,820).
Separately, notice the 20-day moving average (in green) has underpinned recent price action. As always, the 20-day is a widely-tracked near-term trending indicator.
Tactically, follow-through atop resistance (42,820) would mark a material “higher high” strengthening the bull case. The pending retest from underneath will likely add color.
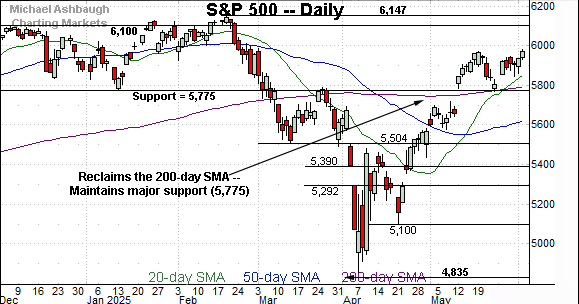
Meanwhile, the S&P 500’s backdrop remains more firmly bullish.
As illustrated, the decisive May breakout has been punctuated by an orderly pullback underpinned by major support (5,775).
The successful retest of support has been punctuated by a rally to tag three-month highs.
The bigger picture
As detailed above, the U.S. benchmarks’ bigger-picture backdrop remains bullish.
On a headline basis, the S&P 500 and Nasdaq Composite have concurrently tagged three-month highs, rising from successful tests of well-defined support. (See the daily charts.)
Against this bullish backdrop, an early-June breakout attempt remains underway.
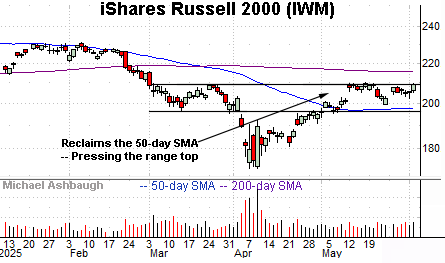
Moving to the small-caps, the iShares Russell 2000 ETF (IWM) is pressing its range top.
Market bulls will point to an inverse head-and-shoulders pattern defined by the March, April and late-May lows.
Tactically, the range top (210.10) defines the pattern’s neckline. A close atop this area would punctuate the bullish pattern, likely opening the path to a test of the 200-day moving average, currently 215.90.
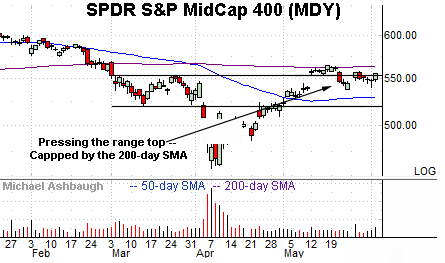
Meanwhile, the SPDR S&P MidCap 400 ETF (MDY) is rising amid a slightly stronger backdrop.
But here again, the mid-cap benchmark is pressing its range top (553), and remains capped by the 200-day moving average, currently 563.20.
The MDY’s relatively tight prevailing range — hinged to the range top — signals muted selling pressure near resistance, laying the groundwork for a potential breakout.
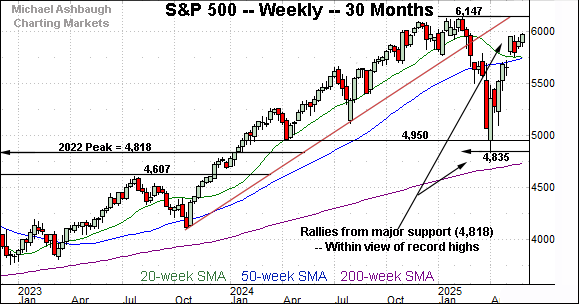
Returning to the S&P 500, this next chart is a weekly view spanning 30 months. Each bar on the chart represents one week.
As illustrated, the S&P has rallied sharply from major support.
Recall the April low (4,835) registered slightly above an important floor matching the 2022 peak (4,818). (See the April 23 review.)
Amid the upturn, the index has reclaimed its 50-week moving average, currently 5,748, rising within striking distance of the record high (6,147) established Feb. 19.
The pending retest of this area — the 6,150 area — will likely add color. As detailed previously, market bulls will point to a massive V-shaped reversal (still underway on this weekly chart), placing record territory within view.

Returning to the S&P 500’s six-month view adds perspective.
Despite recent volatility, the S&P’s prevailing backdrop is actually relatively straightforward.
To start, the index has reasserted a posture atop two familiar — and technically significant — inflection points:
The 200-day moving average, currently 5,792.
The breakdown point (5,775), a level formerly defining the post-election low.
As detailed repeatedly, the cross section of these areas — the 5,775-to-5,790 area — marks a longer-term bull-bear fulcrum. (Also see the April 23 review.)
Moreover, the S&P has successfully retested this area as support. The mid-May low (5,767) registered nearby, and the index has subsequently rallied to tag three-month highs.
Beyond specific levels, the prevailing rally punctuates a bullish V-shaped reversal from the April low. Also recall the rally off the lows initially registered unusually bullish breadth in the form of two 9-to-1 up days. (See the April 23 review.)
Combine the price action with the internals, and the S&P 500’s backdrop remains comfortably bullish. A violation of the 5,775-to-5,790 area would raise a caution flag.
Also see May 20: Charting a primary trend shift, S&P 500 rallies amid V-shaped reversal.
Also see April 23: Charting a corrective bounce, S&P 500 extends potentially viable rally attempt.