


Charting a corrective bounce, S&P 500 extends potentially viable rally attempt
Focus: Prevailing upturn punctuated by unusually bullish breadth

Technically speaking, the major U.S. benchmarks are vying to extend their rally attempt from the April low.
Though the prevailing upturn has been punctuated by unusually bullish breadth — in the form of two 9-to-1 up days — sustainability and upside follow-through remain open questions. The charts below add color:
Editor’s Note: As always, updates can be directly accessed at chartingmarkets.substack.com.
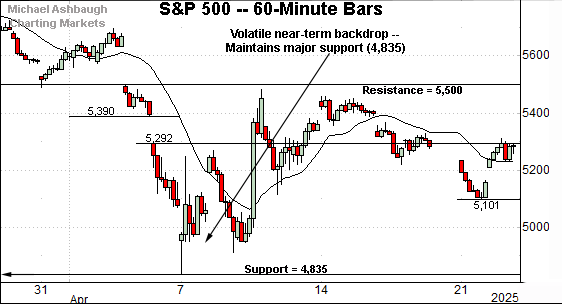
Before detailing the U.S. markets’ wider view, the S&P 500’s hourly chart highlights the past four weeks.
As illustrated, the S&P 500 is vying to rally from 15-month lows.
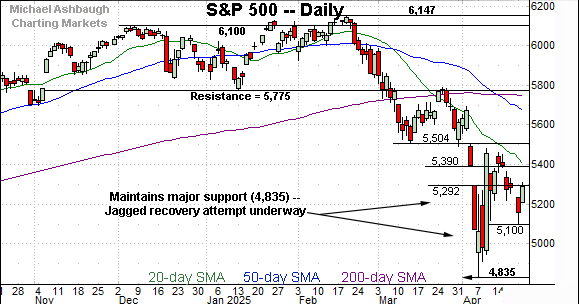
The prevailing rally attempt originates from major support (4,835) — detailed in the next section — though the index has yet to reclaim a headline technical level.
Tactically, gap resistance — at 5,292 and 5,390 — continue to stand out as nearby hurdles.
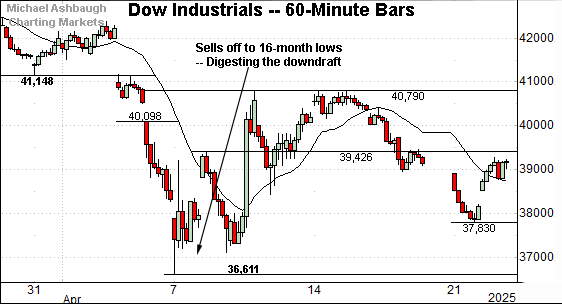
Meanwhile, the Dow Jones Industrial Average is digesting a downdraft to 16-month lows.
Here again, the blue-chip benchmark is rising from a “higher low” — versus the early-April low — which is contructive.
Bearish momentum may be waning, for the near-term. The next several sessions will likely add color.
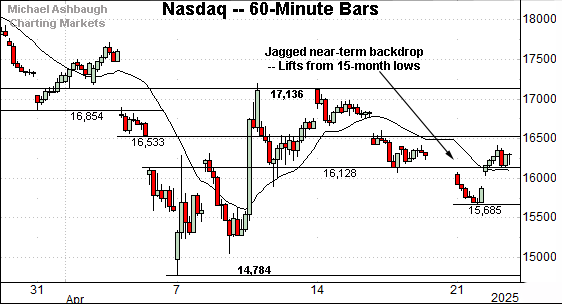
Against this backdrop, the Nasdaq Composite is also vying to stabilize.
Amid the upturn, the index is traversing an unusually wide three-week range also detailed on the daily chart below.
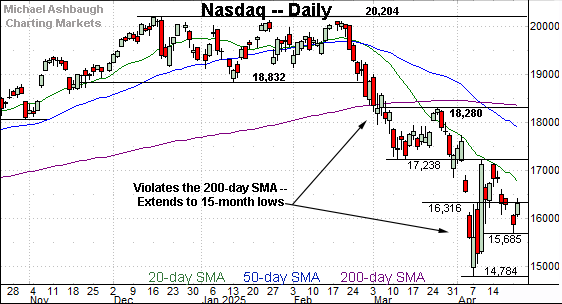
Widening the view to six months adds perspective.
On this wider view, the Nasdaq has whipsawed in the wake of the early-April downdraft. (The wide-ranging price action punctuates the early-March violation of the 200-day moving average.)
Tactically, near-term resistance — around 16,310 and 17,240 — remain the Nasdaq’s inital hurdles.
This is followed by the post-breakdown peak (18,280) an area roughly matching the 200-day moving average, currently 18,350. The Nasdaq’s longer-term bias points lower pending a rally atop these areas.
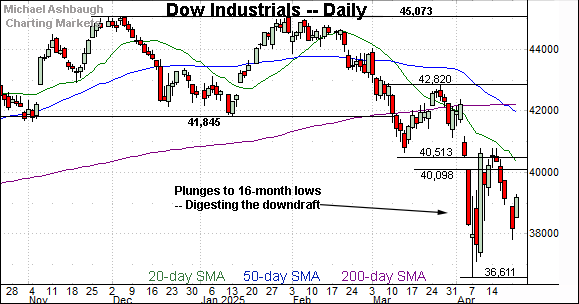
Looking elsewhere, the Dow Jones Industrial Average is also traversing a less-charted patch.
Recall the Dow’s intial downdraft punctuates a double top — the M formation — defined by the December and January peaks.
Tactically, gap resistance — around 40,100 and 40,500 — is followed by the firmer breakdown point (41,845).
An eventual rally atop the breakdown point (41,845) would place the Dow on firmer technical ground.

Meanwhile, the S&P 500 has reversed from 15-month lows.
The prevailing upturn originates from major support (4,835), a familiar area detailed in the next section.
The bigger picture
As detailed above, the major U.S. benchmarks are vying to stabilize in the wake of a damaging market downdraft.
Amid the upturn, each benchmark is rising from a “higher low” versus the early-April low — which is constructive — though durable upside follow-through remains a question mark.
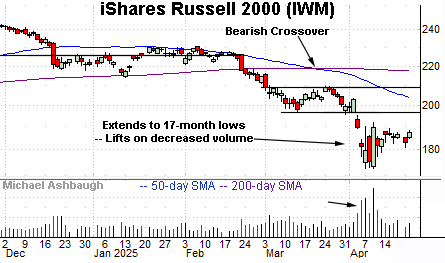
Moving to the small-caps, the iShares Russell 2000 ETF (IWM) is digesting the April breakdown.
Recall the initial downdraft was fueled by a volume spike, placing the small-cap benchmark at 17-month lows.
By comparison, the subsequent rally attempt has been flat — so far — driven by decreased volume.
Tactically, the breakdown point (197) marks notable resistance. Follow-through atop this area would mark technical progress. (The 50-day moving average (in blue) is descending toward the breakdown point.)
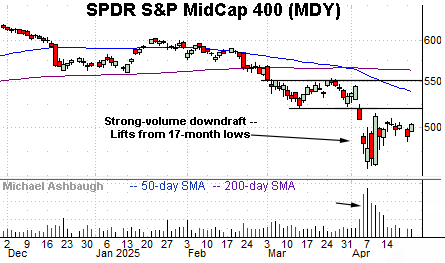
Similarly, the SPDR S&P MidCap 400 ETF (MDY) is vying to rally from 17-month lows.
Here again, the prevailing rally attempt has been flattish, fueled by decreased volume. Tactically, the breakdown point (520) remains an overhead hurdle. The pending retest should be a useful bull-bear gauge.
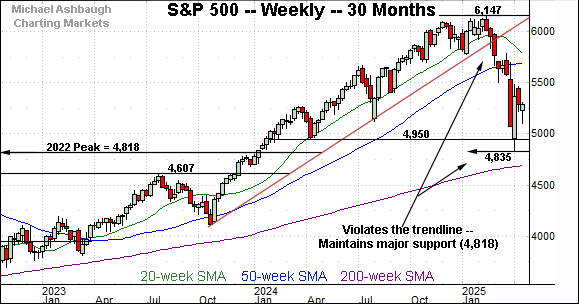
Returning to the S&P 500, this next chart is a weekly view spanning 30 months. Each bar on the chart represents one week.
As illustrated, the S&P is vying to rally from an important floor.
Specifically, recall the April low (4,835) registered slightly above major support matching the 2022 peak (4,818). (See the April 9 review.)
The rally from this area seems to “have a chance” — (to quote Jim Carrey from Dumb and Dumber) — though follow-through atop resistance, detailed below, would strengthen the bull case.
Returning to the S&P 500’s six-month view adds perspective.
As illustrated, the S&P has whipsawed in the wake of the early-April plunge.
And amid the volatility, the prevailing upturn has registered noteworthy internals.
To start, consider that the April 9 spike — the long green bar — marked the S&P 500’s best day since 2008. Perhaps as notably, the single-day rally registered off-the-charts bullish breadth in the form of a 65-to-1 up day. (NYSE advaning volume surpassed declining volume by a 65 to 1 margin.)
Fast forward to this week, and the April 22 rally registered fractionally shy of a 9-to-1 up day.
As always, in a textbook world, two 9-to-1 up days — across about a seven-session window — reliably signals a major trend shift.
In the current case, the S&P 500 has registered two 9-to-1 up days across a nine-session window. So the recent price action is bullish, consistent with a potentially significant market turn.
To be sure, market bears will contend the internals simply the reflect the extremes of an imbalanced, and unhealthy, market backdrop. In this vein, the ongoing quality of the prevailing rally attempt will add color.
When gauging the rally attempt’s quality, gap resistance at 5,292 and 5,390 mark nearby tests. Sustained follow-through atop these areas would signal that a near-term rally attempt remains in play.
More broadly, two more distant technical levels stand out:
The 200-day moving average, currently 5,748.
The breakdown point (5,775), a level formerly defining the post-election low.
As detailed previously, the cross section of these areas — the 5,750-to-5,775 area — marks a longer-term bull-bear fulcrum. (Also see the March 7 review.)
So all told, a near-term rally attempt remains underway. The upturn has registered internal traits consistent with a potentially durable trend shift.
More broadly, the S&P’s sustained posture under major resistance — the 5,775 inflection point — continues to signal a bearish longer-term bias. The response to technical levels, detailed above, will likely add color.
Also see April 9: Charting a bullish reversal, S&P 500 vies to rally from major support (4,818).
Also see March 20: Charting a bearish technical tilt, S&P 500 digests damaging market downdraft.