


Charting a primary trend shift, S&P 500 rallies amid V-shaped reversal
Focus: Major U.S. benchmarks reclaim 200-day moving average

Technically speaking, the major U.S. benchmarks continue to trend higher, extending a persistent rally off the April low.
Amid the upturn, the S&P 500 and Nasdaq Composite have gapped firmly atop the 200-day moving average, rising amid a bullish longer-term backdrop. The charts below add color:
Editor’s Note: As always, updates can be directly accessed at chartingmarkets.substack.com.
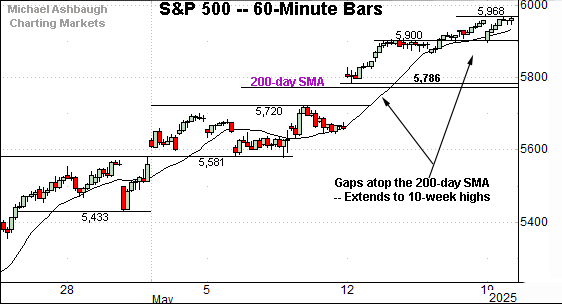
Before detailing the U.S. markets’ wider view, the S&P 500’s hourly chart highlights the past four weeks.
As illustrated, the S&P 500 has reached 10-week highs.
The prevailing upturn has been punctuated by a recent gap atop the 200-day moving average, currently 5,764, a widely-tracked longer-term trending indicator.
Tactically, gap support (5,786) is closely followed by the 200-day moving average. This area matches major support (5,775) detailed on the daily chart.
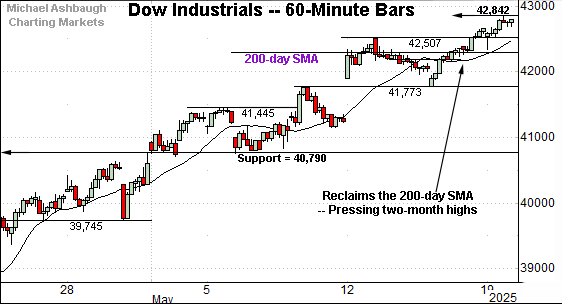
Meanwhile, the Dow Jones Industrial Average is pressing two-month highs.
Here again, recent strength places the index back atop its 200-day moving average, currently 42,308.
More broadly, the Dow is challenging significant resistance (42,820) an area better illustrated on the daily chart.
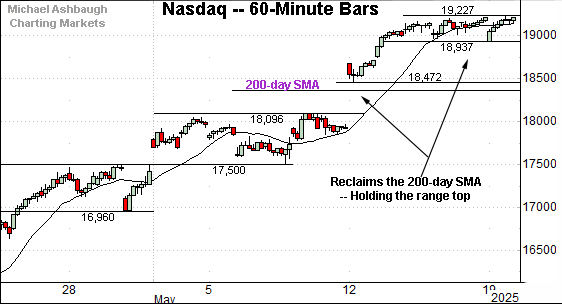
Against this backdrop, the Nasdaq Composite has also extended its rally attempt.
Like the S&P 500, the Nasdaq’s upturn has been punctuated by a recent gap atop its 200-day moving average, currently 18,376.
More immediately, the prevailing flag-like pattern — the tight range near recent highs — signals selling pressure remains limited despite a protracted rally off the lows. (When sellers are absent, prices generally rise to attract new sellers.)
Combined, each big three U.S. benchmark continues to reclaim key technical levels, including the marquee 200-day moving average.
Widening the view to six months adds perspective.
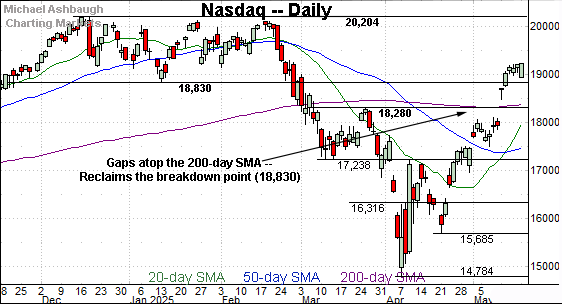
On this wider view, the Nasdaq has staged what is likely a consequential May breakout.
The decisive gap atop the 200-day moving average places the index back within its early-2025 range.
Tactically, the former breakdown point (18,830) pivots to support and is followed by the 200-day moving average, currently 18,376. A sustained posture atop the 200-day signals a bullish longer-term bias.
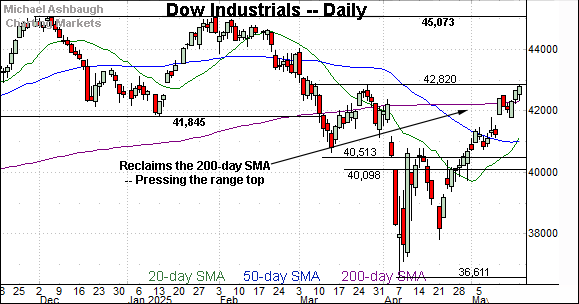
Looking elsewhere, the Dow Jones Industrial Average is lagging slightly behind the other benchmarks. This is the only index still capped by the late-March peak.
Nonetheless, the Dow has ventured back atop its 200-day moving average, currently 42,308, rising to challenge its range top (42,820).
Follow-through atop resistance (42,820) would mark a material “higher high” incrementally strengthening the bull case.

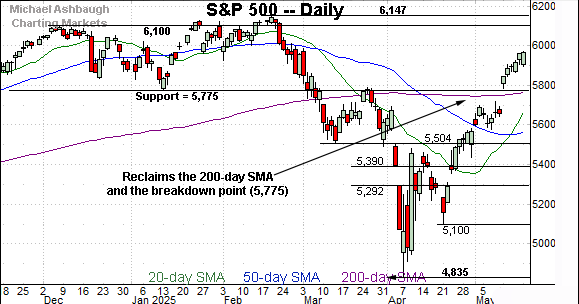
Meanwhile, the S&P 500 has staged the headline May breakout.
Recent strength places the S&P back atop its breakdown point (5,775) as well as the 200-day moving average, currently 5,764.
This area pivots to important support. A sustained posture higher signals a bullish longer-term bias.
The bigger picture
As detailed above, the major U.S. benchmarks have extended a persistent rally off the April low.
Amid the upturn, the S&P 500 and Nasdaq Composite have gapped firmly atop the 200-day moving average, rising to tag nearly three-month highs. Bullish price action.
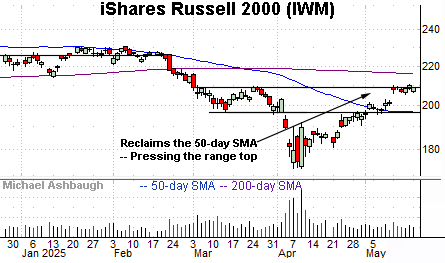
Moving to the small-caps, the iShares Russell 2000 ETF (IWM) has extended a comparably less impressive rally attempt.
Nonetheless, the small-cap benchmark has reclaimed its 50-day moving average, rising to challenge a nearly three-month range top (209).
The prevailing tight one-week range signals muted selling pressure near resistance, improving the chances of eventual upside follow-through.
On further strength, the 200-day moving average, currently 215.95, marks a slightly more distant hurdle.
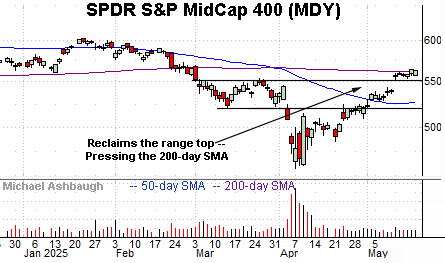
Meanwhile, the SPDR S&P MidCap 400 ETF (MDY) has registered a slightly stronger recovery attempt.
As illustrated, the mid-cap benchmark has reclaimed its range top (553), rising to challenge the 200-day moving average, currently 562.50.
Here again, the MDY’s tight one-week range signals muted selling pressure, laying the groundwork for a potential breakout.
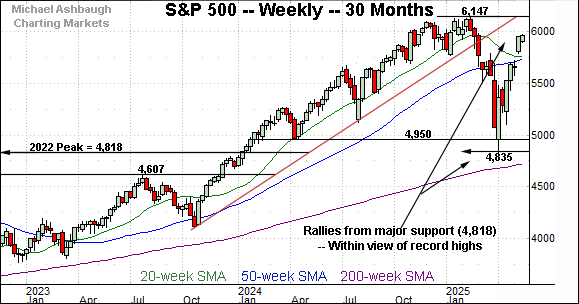
Returning to the S&P 500, this next chart is a weekly view spanning 30 months. Each bar on the chart represents one week.
As illustrated, the S&P has rallied sharply from major support.
Recall the April low (4,835) registered slightly above an important floor matching the 2022 peak (4,818). (See the April 23 review.)
Amid the upturn, the index has reclaimed its 50-week moving average, currently 5,730, rising within striking distance of the record high (6,147) established Feb. 19. About three months ago.
The pending retest of this area — the 6,150 area — will likely add color. Market bulls will point to a massive V-shaped reversal (still underway on this weekly chart), placing record territory within view.
Returning to the S&P 500’s six-month view adds perspective.
As illustrated, the S&P has reclaimed two familiar — and technically significant — inflection points:
The 200-day moving average, currently 5,764.
The breakdown point (5,775), a level formerly defining the post-election low.
As detailed repeatedly, the cross section of these areas — the 5,765-to-5,775 area — marks a longer-term bull-bear fulcrum. (Also see the April 23 review.)
Against this backdrop, it’s not just what the markets do, it’s how they do it.
By this measure, the S&P’s decisive spike atop major resistance — on the first approach from underneath — is unusual, considering the preceding downdraft’s aggressiveness, and strengthens the bull case.
Separately, the May breakout punctuates a bullish V-shaped reversal from the April low.
Collectively, the S&P 500 has escaped its tariff-fueled crash-like price zone with the mid-May breakout. The prevailing backdrop supports a bullish longer-term bias barring a violation of the 5,765-to-5,775 area.
Also see May 6: Charting a bull-bear battle, S&P 500 reaches contested zone.
Also see April 23: Charting a corrective bounce, S&P 500 extends potentially viable rally attempt.