Charting a slight breakout, S&P 500 inches to record territory
Focus: Gold violates major support, Emerging Markets ETF stalls at 200-day average, GLD, EEM, MSFT, PG, DXCM, SPLK
U.S. stocks are mixed early Monday, vacillating amid easing crude-oil prices, fueled by virus-related concerns over global growth.
Against this backdrop, the S&P 500 and Dow Jones Industrial Average are digesting their latest modest breaks to record territory.
Editor’s Note: As always, updates can be directly accessed at chartingmarkets.substack.com.
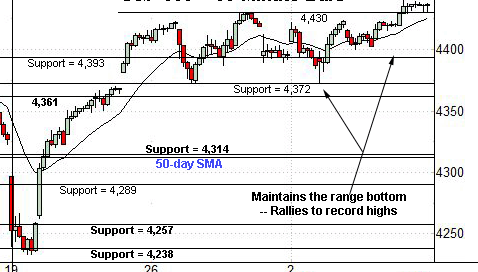
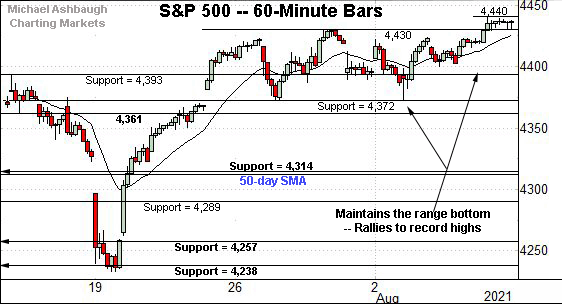
Before detailing the U.S. markets’ wider view, the S&P 500’s hourly chart highlights the past four weeks.
As illustrated, the S&P has tagged yet another record high (4,440.82).
The slight breakout punctuates an orderly two-week range, underpinned by familiar support (4,372). Bullish price action.
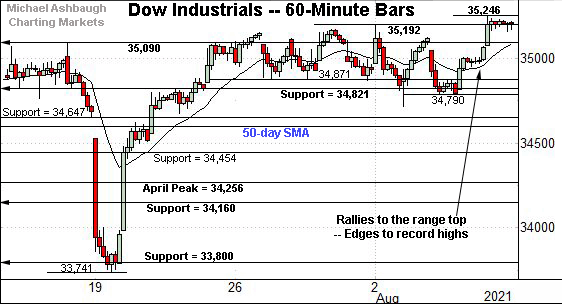
Similarly, the Dow Jones Industrial Average has tagged a nominal record high.
Here again, the prevailing upturn punctuates a relatively orderly two-week range.
Tactically, near-term support matches the May peak (35,091), an area also detailed on the daily chart.
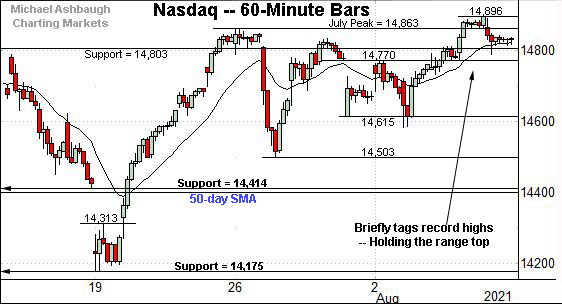
Against this backdrop, the Nasdaq Composite has pulled in modestly from record highs.
From current levels, initial support matches the former range top (14,803), detailed previously.
Monday’s early session low (14,802.7) has registered nearby.
Widening the view to six months adds perspective.
On this wider view, the Nasdaq is pressing its range top. The prevailing upturn punctuates a two-week range, underpinned by the 20-day moving average.
More broadly, the Nasdaq’s breakout attempt originates from a successful test of the breakout point (14,175). The July low (14,178) registered nearby.
Also recall the mid-June breakout resolved a double bottom defined by the March and May lows. A near- to intermediate-term target continues to project to the 15,420 area, detailed previously.
Looking elsewhere, the Dow Jones Industrial Average has tagged a nominal record high.
The prevailing upturn punctuates a tight two-week range — a coiled spring — laying the groundwork for a potentially more decisive breakout.
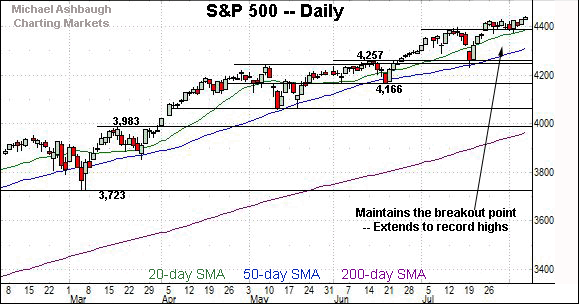
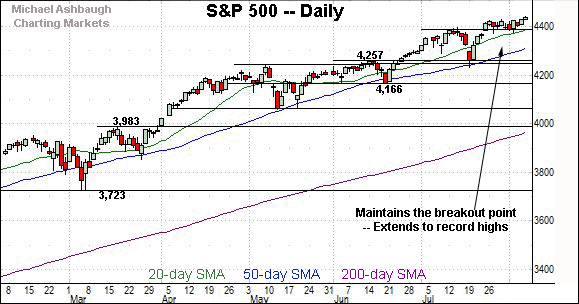
Meanwhile, the S&P 500 has tagged a nominal record high, rising from a familiar flag-like pattern.
Tactically, the breakout point (4,393) is followed by the former range bottom (4,372) areas also detailed on the hourly chart.
The bigger picture
As detailed above, the major U.S. benchmarks are off to an unseasonally bullish August start.
On a headline basis, each big three U.S. benchmark tagged an all-time high last week, though in admittedly less-than-decisive form.
Nonetheless, the slight breakouts have registered amid broadening sector participation, strengthening the bull case.
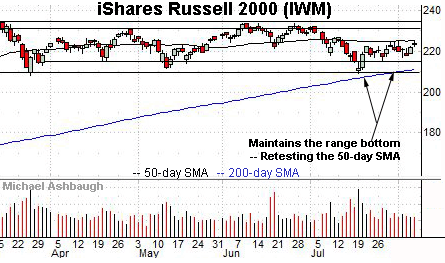
Moving to the small-caps, the iShares Russell 2000 ETF remains range-bound.
Within the range, the flatlining 50-day moving average, currently 224.94, remains an inflection point.
Meanwhile, the SPDR S&P MidCap 400 ETF has sustained a very slight break atop its 50-day moving average, currently 490.72.
Placing a finer point on the S&P 500, the index has tagged a nominal record high.
The prevailing breakout attempt has been punctuated by consecutive record closes.
Tactically, a near-term target projects from the former range to the 4,488 area.
More broadly, the S&P 500’s prevailing upturn punctuates a bullish continuation pattern, effectively underpinned by the breakout point (4,393).
More distant intermediate-term targets continue to project from the July range to the 4,510 and 4,553 areas.
Beyond specific levels, the early-August price action remains rotational, on balance, amid broadening sector participation, detailed repeatedly. All trends technically point higher as it applies to the S&P 500.
Watch List
Drilling down further, the SPDR Gold Shares ETF has asserted a bearish posture.
The shares initially plunged seven weeks ago, gapping under the 50-day moving average after unexpectedly hawkish-leaning Fed policy language.
The subsequent rally attempt has been comparably flat, and capped by the 50-day moving average.
More immediately, the prevailing strong-volume downturn places major support (164.00) under siege.
The GLD has ventured under support early Monday. A close near current levels would confirm the bearish mid-June trend shift.
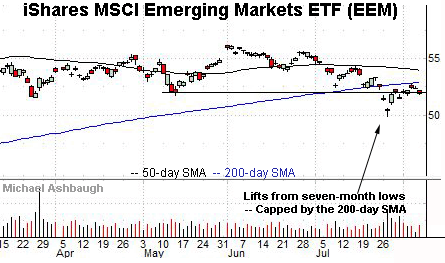
Looking elsewhere, the iShares MSCI Emerging Markets ETF is also tenuously positioned.
The shares initially plunged two weeks ago, tagging seven-month lows amid a volume spike.
The subsequent bounce has been comparably flat, capped by the 200-day moving average, currently 52.94.
Separately, an inflection point matches the July breakdown point (52.00).
Tactically, an eventual close atop the breakdown point and the 200-day moving average would place the shares on firmer technical ground. The prevailing retest from underneath will likely add color.
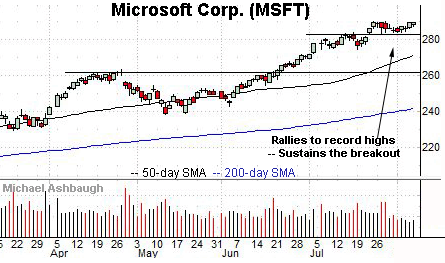
Moving to specific names, Microsoft Corp. is a well positioned Dow 30 component.
Late last month, the shares tagged record highs, clearing resistance matching the early-July peak.
More immediately, the prevailing flag-like pattern positioned the shares to extend the uptrend. Tactically, a sustained posture atop the breakout point (282.50) signals a firmly-bullish bias.
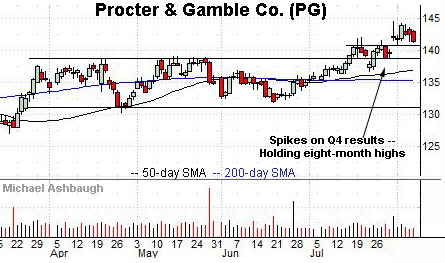
Procter & Gamble Co. is another well positioned Dow 30 component. (Yield = 2.5%.)
Late last month, the shares knifed to eight-month highs, rising after the company’s fourth-quarter results.
The subsequent flag pattern has formed amid decreased volume, positioning the shares to build on the initial spike.
Tactically, the breakout point (140.80) is followed by the former range top (138.90). The prevailing rally attempt is intact barring a violation.
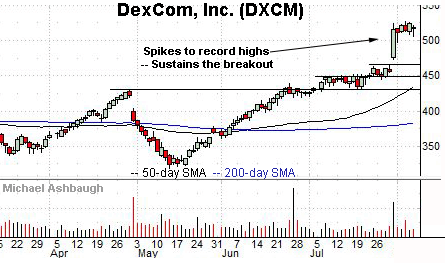
DexCom, Inc. is a large-cap developer of glucose monitoring systems used for diabetes treatment.
Technically, the shares have recently knifed to all-time highs, rising amid a volume spike after the company’s quarterly results.
By comparison, the ensuing pullback has been flat, positioning the shares to build on the initial spike.
Tactically, the post-breakout low (497.50) is followed by gap support (473.25). A sustained posture higher signals a bullish bias.
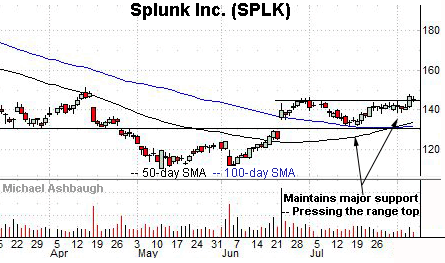
Finally, Splunk, Inc. is a large-cap developer of software and cloud solutions.
As illustrated, the shares have rallied to the range top, rising to challenge three-month highs.
The prevailing upturn punctuates a tight two-week range, laying the groundwork for potentially decisive follow-through. Tactically, a breakout attempt is in play barring a violation of near-term support (138.45).
Note the company’s quarterly results are due out Aug. 25.

