Charting a shaky technical tilt, S&P 500 violates the breakout point
Focus: 10-year Treasury yield rising from double bottom, Japan retests major support, TNX, EWJ, GM, CSCO
Technically speaking, the U.S. benchmarks’ bigger-picture backdrop has registered a shaky technical tilt.
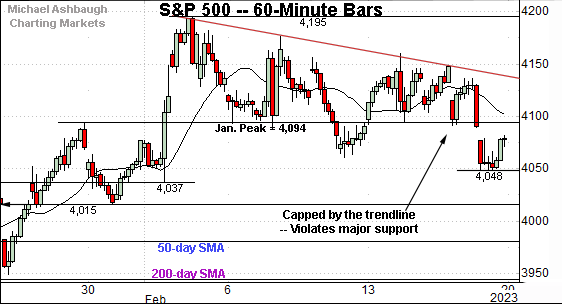
On a headline basis, the S&P 500 violated its breakout point (4,094) and downside follow-through has registered amid a pronounced volatility spike. The downdraft coincides with surging Treasury yields, including the 10-year Treasury note yield’s potentially consequential breakout attempt.
Editor’s Note: As always, updates can be directly accessed at https://chartingmarkets.substack.com.
Before detailing the U.S. markets’ wider view, the S&P 500’s hourly chart highlights the past four weeks.
As illustrated, the S&P has extended a pullback from the range top.
The prevailing downturn places it under the breakout point (4,094), a near-term bull-bear fulcrum detailed repeatedly.
Meanwhile, the Dow Jones Industrial Average is traversing a relatively well-defined range.
Tactically, the 50-day moving average, currently 33,624, is followed by major support (33,418) an area also illustrated on the daily chart.
Against this backdrop, the Nasdaq Composite is digesting an early-month breakout.
Tactically, the Feb. peak (12,269) matched major resistance (12,270) also detailed on the daily chart below.
More immediately, the prevailing downturn places the post-breakout low (11,630) under siege.
Widening the view to six months adds perspective.
On this wider view, the Nasdaq has extended a pullback from the range top (12,270).
On further weakness, important support matches the breakout point (11,492) and the 200-day moving average, currently 11,414.
Broadly speaking, the Nasdaq’s backdrop supports a bullish intermediate- to longer-term bias barring a violation of the 11,415-to-11,490 area.
Looking elsewhere, the Dow Jones Industrial Average is traversing a tight February range.
Tactically, the 50-day moving average, currently 33,624, has thus far underpinned the range on a closing basis.
Still, the index has ventured firmly under its 50-day moving average early Tuesday. Delving deeper, notable support broadly spans from about 33,240 to 33,420.
Separately, recall the tight February range lays the groundwork for a potentially decisive break in either direction. Against today’s backdrop, swift downside acceleration is a “watch out.” (See the Feb. 15 review.)
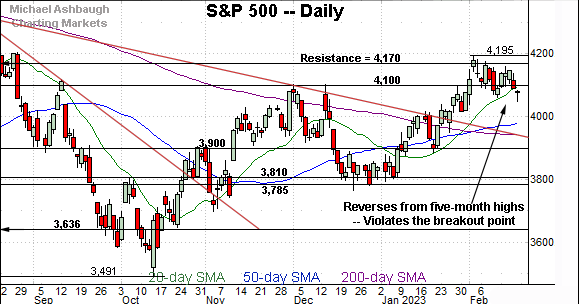
Meanwhile, the S&P 500 has ventured under major support.
As detailed repeatedly, the breakout point — the 4,094-to-4,100 area — marks a notable floor. (See the Dec. peaks (4,100) and the Jan. peak (4,094).)
Separately, the 20-day moving average, currently 4,094, has marked an early-year inflection point, and matches major support. The prevailing downturn raises the flag to a near-term trend shift.
The bigger picture
Broadly speaking, the U.S. benchmarks’ bigger-picture backdrop — partly with the benefit of Tuesday’s early price action — has registered a shaky technical tilt.
On a headline basis, the S&P 500 violated its breakout point (4,094) to conclude last week, and respectable downside follow-through has subsequently registered.
At the same time, the Dow Jones Industrial Average has ventured firmly under its 50-day moving average, pressured to punctuate a tight February range.
Moving to the small-caps, the iShares Russell 2000 ETF (IWM) is digesting a break to five-month highs.
Tactically, the breakout point (189.90) is closely followed by the Feb. low (188.53). A closing violation of this area would raise a technical question mark.
Slightly more broadly, the 50- and 200-day moving averages remain deeper inflection points.
Meanwhile, the SPDR S&P MidCap 400 ETF (MDY) is digesting a break to 10-month highs.
From current levels, the post-breakout low (477.50) is closely followed by the breakout point (475.15).
Delving deeper, the 50-day moving average marked a December inflection point, and is rising toward support.
Returning to the S&P 500, the index has violated its first notable floor.
The specific area matches the breakout point — the 4,094-to-4,100 area — detailed repeatedly. Also recall the 20-day moving average, currently 4,094, matches support and has marked an early-year inflection point.
Delving deeper, the S&P 3,950 area remains a more important floor. To reiterate, this area matches the post-breakout low (3,949), the trendline and the 200-day moving average (3,942).
As always, it’s not just what the markets do, it’s how they do it. But broadly speaking, the S&P 500’s longer-term bias remains bullish barring a violation of the 3,950 area. (Also recall the Nasdaq 11,415-to-11,490 area marks a bull-bear fulcrum.)
Beyond specific levels, the 10-year Treasury note yield’s backdrop — detailed in the next section — marks a potential concern. The yield has ventured to a higher plateau, a backdrop that, if sustained, would present an added broad-market headwind.
(On a granular note, the CBOE Volatility Index (VIX) concluded last week with its first close atop the 50-day moving average since October and material upside follow-through has registered early Tuesday.)
Watch List
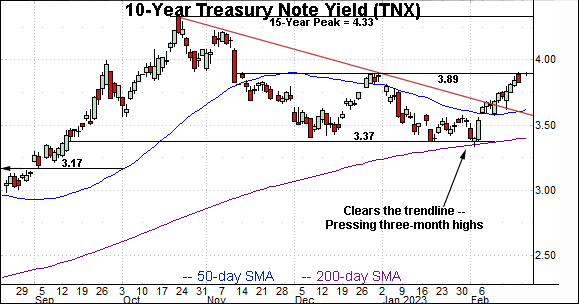
Drilling down further, the 10-year Treasury note yield (TNX) is challenging three-month highs.
The prevailing upturn punctuates a double bottom — defined by the December and February lows — and originates from the 200-day moving average.
Tactically, an upside target projects to the 4.40 area, and could be reached relatively swiftly, on follow-through. (Recent round-trips through the prevailing range have spanned two to three weeks.)
More broadly, the yield is digesting a massive 2022 spike — illustrated on the monthly chart — after tagging its highest level since November 2007.
Beyond the U.S., the iShares MSCI Japan ETF (EWJ) is acting well technically.
As illustrated, the shares have staged an orderly pullback from 10-month highs.
Tactically, the breakout point (56.60) closely matches the 50-day moving average, currently 56.40. The pending retest of this area is worth tracking.
Delving deeper, the 200-day moving average, currently 52.24, marked a December (late-2022) inflection point. (The late-year price action signaled indecision as to the primary trend.)
Moving to specific names, Cisco Systems, Inc. (CSCO) is a Dow 30 component coming to life. (Yield = 3.1%.)
Late last week, the shares knifed to nine-month highs, rising after the company’s strong second-quarter results, and upwardly revised outlook. Though near-term extended, and due to consolidate, the strong-volume spike is longer-term bullish.
Tactically, gap support (49.80) is closely followed by the breakout point (49.30). A sustained posture higher signals a bullish bias.
More broadly, the prevailing upturn punctuates a three-month range underpinned by the 200-day moving average (in blue).
Finally, General Motors Co. (GM) is a well positioned large-cap name.
As illustrated, the shares have tagged 10-month highs, clearing resistance matching the November peak.
More broadly, the shares have reached a less-charted patch — atop the 200-week moving average — as illustrated below.
Tactically, the breakout point (41.50) is followed by slightly deeper gap support (39.90). The prevailing rally attempt is intact barring a violation. (Also see the strong-volume January spike illustrated on the weekly chart below.)
Editor’s Note: The next review will be published Thursday, Feb. 23.


