Charting a bullish holding pattern, S&P 500 sustains trendline breakout
Focus: Russell 2000 nails the breakout point, Dow industrials tag the range top
Technically speaking, the major U.S. benchmarks have asserted a February holding pattern.
The largely sideways price action is nonetheless constructive, signaling still muted selling pressure in the wake of decisive early-month breakouts.
Editor’s Note: As always, updates can be directly accessed at https://chartingmarkets.substack.com.
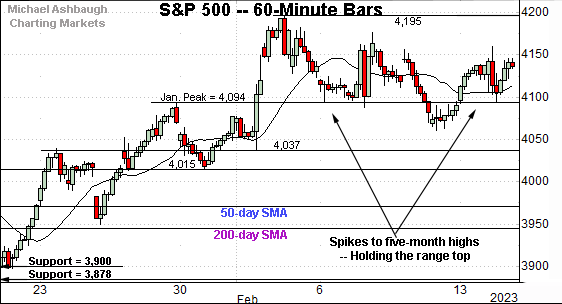
Before detailing the U.S. markets’ wider view, the S&P 500’s hourly chart highlights the past four weeks.
As illustrated, the S&P has asserted a holding pattern, digesting a recent spike to five-month highs.
Tactically, the Jan. peak (4,094) remains a notable floor, detailed repeatedly.
Friday’s session low (4,092) and Monday’s session low (4,095) have registered nearby.
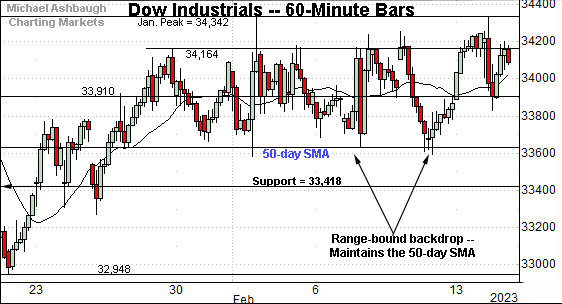
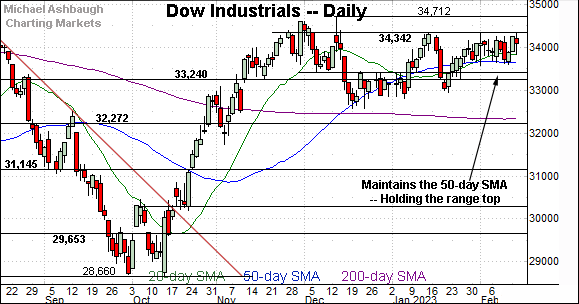
Meanwhile, the Dow Jones Industrial Average is traversing a more prolonged range.
Tactically, its February price action has been underpinned by the 50-day moving average, currently 33,628.
Conversely, the Jan. peak (34,342) defines the range top.
The early-Feb. peak (34,334) and mid-Feb. peak (34,331) have registered within 11 points. (Also see the daily chart.)
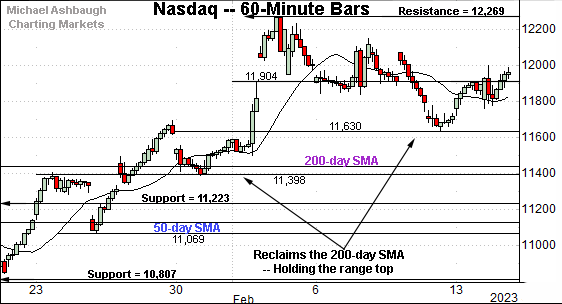
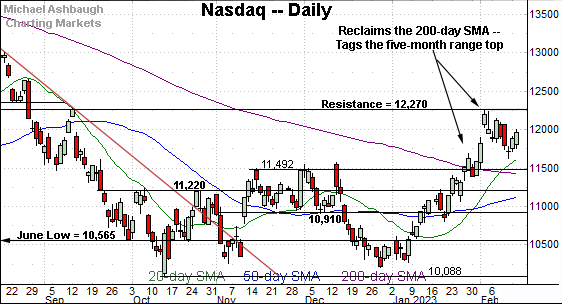
Against this backdrop, the Nasdaq Composite is also acting well technically.
The prevailing sideways range punctuates an aggressive break atop the 200-day moving average, currently 11,428.
From current levels, the early-month gap (11,904) and the post-breakout low (11,630) mark inflection points.
Widening the view to six months adds perspective.
On this wider view, the Nasdaq has pulled in from its five-month range top (12,270).
The Feb. peak (12,269) matched resistance and thus far modest selling pressure has surfaced.
Conversely, the index has sustained a decisive break atop the 200-day moving average. The Nasdaq’s backdrop supports a bullish bias barring a violation of the 11,430-to-11,490 area.
Looking elsewhere, the Dow Jones Industrial Average has asserted an unusually tight February range.
To reiterate, the 50-day moving average, currently 33,628, has underpinned the prevailing range.
Conversely, the Jan. peak (34,342) — detailed previously — has capped the recent price action. (Also see the Nov. closing peak (34,347).
Tactically, the tight February range marks a coiled spring, laying the groundwork for a potentially decisive break in either direction. (Once the break registers, swift acceleration is a “watch out.”)
More broadly, recall the developing cup-and-handle, a bullish pattern defined by the October and December lows. The prevailing backdrop favors eventual upside follow-through. Time will tell.
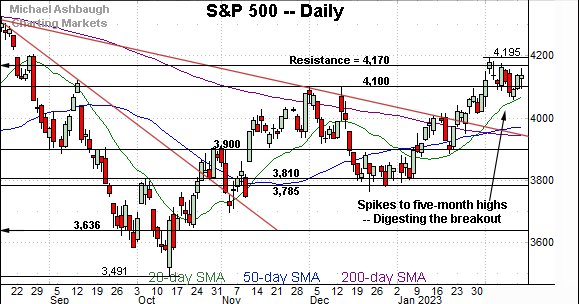
Meanwhile, the S&P 500 is digesting a recent spike to five-month highs.
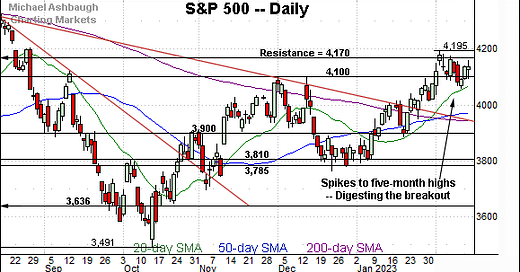
Tactically, recall the breakout point — the 4,094-to-4,100 area — marks a notable floor. (See the Dec. peaks (4,100) and the Jan. peak (4,094).)
Delving deeper, the 20-day moving average, currently 4,078, has marked an early-year inflection point. As always, the 20-day is a widely-tracked near-term trending indicator.
The bigger picture
As detailed above, the U.S. benchmarks’ February price action remains bullish.
On a headline basis, the S&P 500 and Nasdaq Composite have asserted relatively well-defined ranges, digesting aggressive early-month breakouts.
Meanwhile, the Dow Jones Industrial Average is traversing a tight prolonged range amid well-defined inflection points. (The 50-day moving average, and the 34,340 area.)
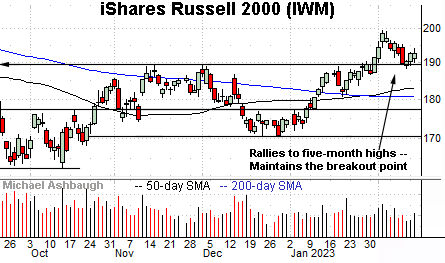
Moving to the small-caps, the iShares Russell 2000 ETF (IWM) has sustained a break to five-month highs.
Tactically, the recent pullback has been underpinned by the breakout point (189.90), an area detailed previously.
The February closing low (189.93) has registered nearby.
Delving deeper, the 50- and 200-day moving averages remain inflection points.
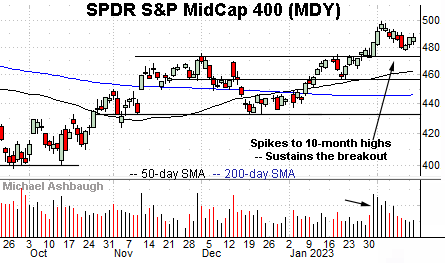
Similarly, the SPDR S&P MidCap 400 ETF (MDY) is digesting an early-year breakout.
The subsequent pullback has been comparably flat, fueled by decreased volume. Bullish price action.
Tactically, the post-breakout low (477.50) is followed by the slightly deeper breakout point (475.15).
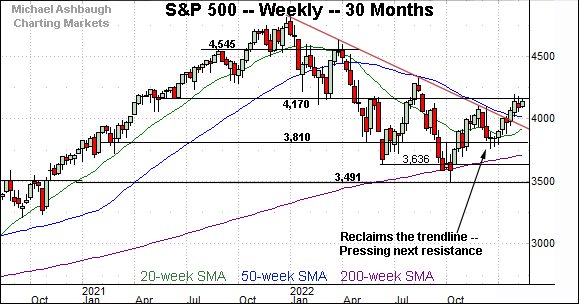
Returning to the S&P 500, this next chart is a weekly view spanning 30 months. Each bar on the chart represents one week.
As illustrated, the S&P 500 has sustained its early-year trendline breakout, notching three straight weekly closes higher.
The upturn has thus far been capped by next resistance (4,170), an area also detailed on the daily chart below.
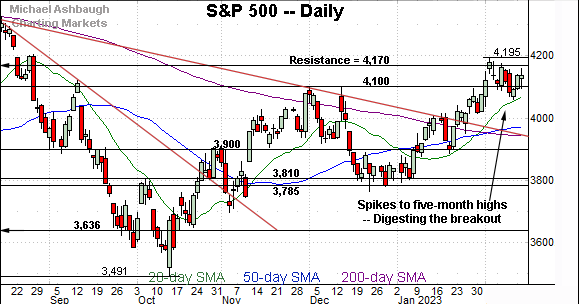
Narrowing to the S&P 500’s six-month view adds perspective.
On this daily chart, the S&P 500 is digesting an aggressive trendline breakout. Recall the upturn punctuates a cup-and-handle defined by the October and December lows.
Against this backdrop, the breakout point — the 4,094-to-4,100 area — remains a notable floor. The 20-day moving average, currently 4,078, has underpinned the prevailing uptrend and is rising toward support.
Delving deeper, the S&P 3,950 area remains a more important floor. This area matches the post-breakout low (3,949), the trendline and the 200-day moving average (3,944).
Tactically, the S&P 500’s backdrop supports a bullish intermediate- to longer-term bias barring a violation of the 3,950 area. (Also recall the Nasdaq 11,430-to-11,490 area marks a bull-bear fulcrum.)
Beyond specific levels, the largely sideways February price action is constructive, signaling still muted selling pressure as the U.S. benchmarks work off a previously extended posture. No new setups today.
Editor’s Note: The next review will be published Tuesday, Feb. 21.

