Charting a bull-trend pullback, S&P 500 maintains the breakout point
Focus: Dow transports sustain trendline breakout, Microsoft reclaims 200-day average amid AI-powered optimism, TRAN, MSFT, AMAT
Technically speaking, the major U.S. benchmarks have asserted a holding pattern, largely treading water in the wake of an aggressive technical breakout.
Against this backdrop, the S&P 500 has thus far maintained its breakout point (4,094) an area matching its first notable support.
Editor’s Note: As always, updates can be directly accessed at https://chartingmarkets.substack.com.
Before detailing the U.S. markets’ wider view, the S&P 500’s hourly chart highlights the past four weeks.
As illustrated, the S&P continues to digest its February breakout.
Tactically, the Jan. peak (4,094) remains a notable floor, an area also detailed on the daily chart. Consecutive session lows registered nearby.
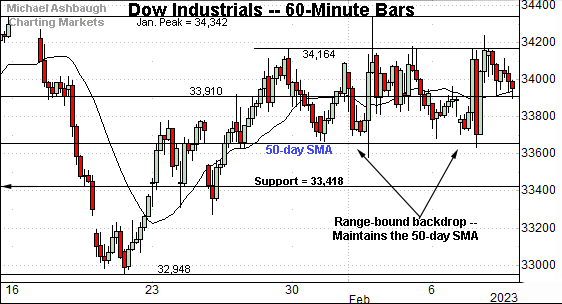
Meanwhile, the Dow Jones Industrial Average remains range-bound.
Within the range, the blue-chip benchmark has maintained its 50-day moving average, currently 33,655.
Conversely, near-term resistance (34,164) is followed by the Jan. peak (34,342). Recall last week’s high (34,334) — also the Feb. peak — registered within eight points of the range top.
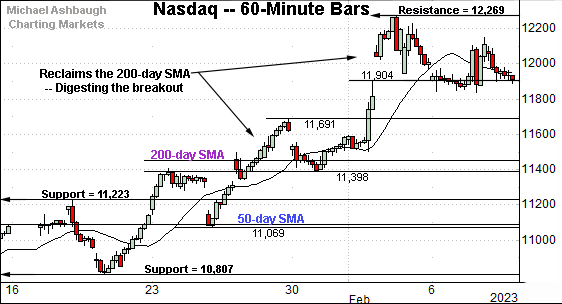
Against this backdrop, the Nasdaq Composite continues to digest an aggressive breakout.
Recent strength places the index firmly atop its 200-day moving average, currently 11,442.
Tactically, gap support (11,904) is followed by the Jan peak (11,691), areas detailed Tuesday. Wednesday’s close (11,910) roughly matched gap support.
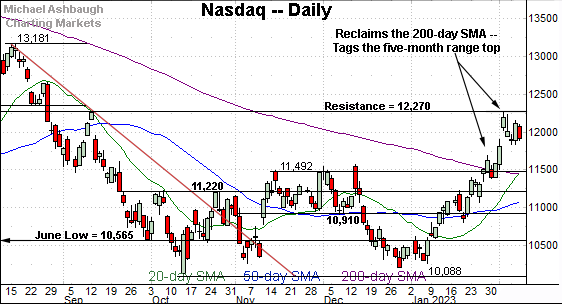
Widening the view to six months adds perspective.
On this wider view, the Nasdaq has knifed atop its 200-day moving average, rising to nail the five-month range top (12,270).
Last week’s high (12,269) matched the range top and thus far modest selling pressure has surfaced.
Though still near-term extended, the decisive break atop the 200-day moving average — (a massive 6.3% technical breakout) — signals a primary trend shift.
Tactically, the Nasdaq’s backdrop supports a bullish bias barring a violation of the 11,450-to-11,490 area.
Looking elsewhere, the Dow Jones Industrial Average has flatlined to start February.
This is still the only major benchmark not tagging multi-month highs.
Nonetheless, the index is holding its range top, and has maintained a posture atop its 50-day moving average, currently 33,655. Constructive price action.
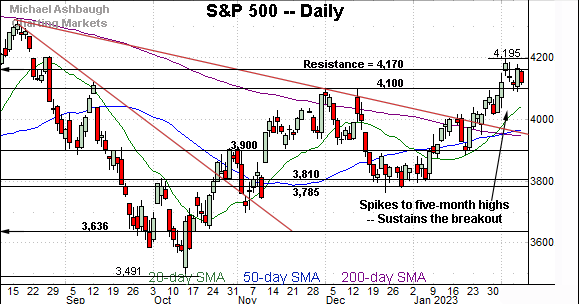
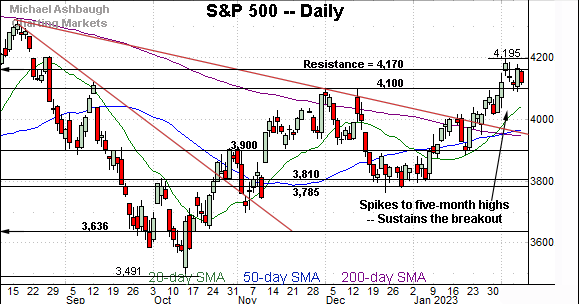
Meanwhile, the S&P 500 has sustained a break to five-month highs.
Tactically, the breakout point — the 4,094-to-4,100 area — pivots to support. (See the Dec. peaks (4,100) and the Jan. peak (4,094).)
Six straight closes have registered atop the breakout point. Constructive price action.
The bigger picture
As detailed above, the major U.S. benchmarks are acting well technically.
On a headline basis, the S&P 500 and Nasdaq Composite have sustained aggressive technical breakouts, consolidating amid thus far muted February selling pressure.
Meanwhile, the Dow Jones Industrial Average continues to hold its range top, treading water amid rotational price action.
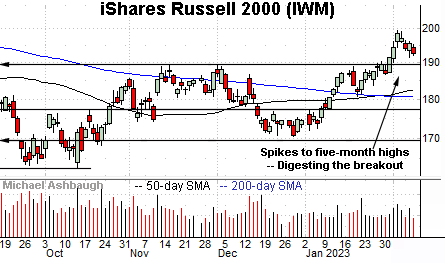
Moving to the small-caps, the iShares Russell 2000 ETF (IWM) has sustained a break to five-month highs.
Tactically, the breakout point (189.90) pivots to support.
Delving deeper, the 50- and 200-day moving averages remain inflection points. Recall the golden cross, or 50-day/200-day moving average crossover, to conclude January.
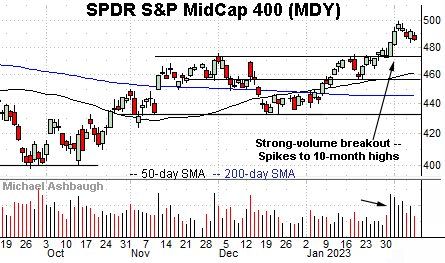
Meanwhile, the SPDR S&P MidCap 400 ETF (MDY) is digesting a break to 10-month highs.
Here again, the breakout point (475.15) pivots to support.
Slightly more broadly, the recent strong-volume spike has been punctuated by a flattish pullback, fueled by progressively decreased volume. Bullish price action.
Returning to the S&P 500, this next chart is a weekly view spanning 30 months. Each bar on the chart represents one week.
As illustrated, the S&P 500 has sustained a potentially consequential trendline breakout. The index is vying this week to register its third straight weekly close atop the trendline.
Narrowing to the S&P 500’s six-month view adds perspective.
On this daily chart, the S&P 500 is digesting an aggressive trendline breakout. The prevailing upturn punctuates a cup-and-handle defined by the October and December lows.
Against this backdrop, the breakout point — the 4,094-to-4,100 area — pivots to support. To reiterate, six straight closes have registered atop the breakout point.
Delving deeper, the S&P 3,950 area remains a more important floor. This area matches the post-breakout low (3,949) as well as the 50-day moving average (3,967) and 200-day moving average (3,945).
As always, it’s not just what the markets do, it’s how they do it. But broadly speaking, the S&P 500’s intermediate- to longer-term bias remains bullish barring a violation of the 3,950 area. (Also recall the Nasdaq 11,450-to-11,490 area marks a bull-bear fulcrum.)
Editor’s Note: The next review will be published Wednesday, Feb. 15.
Watch List
Drilling down further, the Dow Transports (TRAN) — most recently profiled Jan. 26 — have taken flight.
Earlier this month, the group tagged 10-month highs, knifing decisively atop trendline resistance.
The subsequent bull flag — the tight four-session range — is a continuation pattern, positioning the group to build on the initial spike.
Tactically, the post-breakout low (15,256) is followed by the deeper breakout point (14,690). The group’s rally attempt is intact barring a violation.
Moving to specific names, Microsoft Corp. (MSFT) is a Dow 30 component coming to life.
As illustrated, the shares have knifed to challenge five-month highs, rising amid optimism over the company’s newly AI-powered version of search engine Bing.
The prevailing upturn places the shares firmly atop trendline resistance, tracking the 200-day moving average, signaling a longer-term trend shift.
Tactically, near-term support (264.60) is followed by the post-breakout low (254.80) and the slightly deeper trendline. A sustained posture atop the trendline, and the 200-day moving average, signals a firmly-bullish bias.
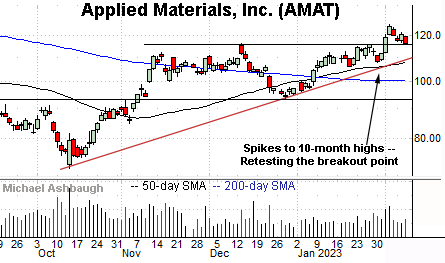
Finally, Applied Materials, Inc. (AMAT) is a well positioned large-cap chip equipment name.
The shares started February with a breakout, knifing to 10-month highs. The subsequent pullback has been orderly, placing the shares near the breakout point (115.40) and 7.7% under the Feb. peak.
Delving deeper, the 50-day moving average (107.90) closely matches trendline support, and is rising toward the breakout point. The prevailing rally attempt is intact barring a violation of these areas.
Note the company’s quarterly results are due out Feb. 16.


