Charting a shaky technical tilt, S&P 500 back for latest crack at major support
Focus: Financials challenge 200-day average, QQQ ventures under its breakout point, Russell 2000 presses major support
U.S. stocks are firmly lower mid-day Monday, pressured as a December volatility spike persists.
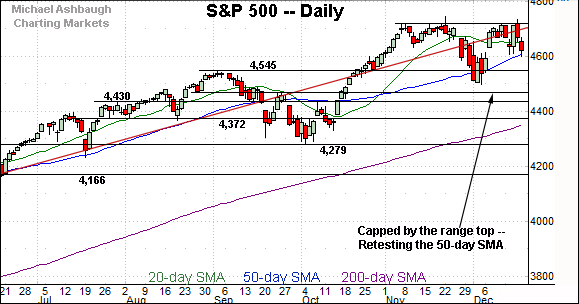
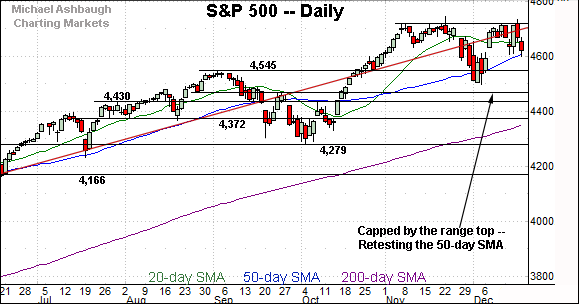
Against this backdrop, the S&P 500 is back for another crack at important support — the S&P 4,545 area — positioning it precariously to start a holiday-shortened trading week.
Editor’s Note: As always, updates can be directly accessed at chartingmarkets.substack.com.
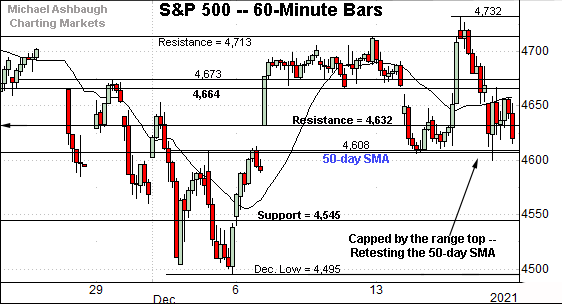
Before detailing the U.S. markets’ wider view, the S&P 500’s hourly chart highlights the past four weeks.
As illustrated, the S&P is traversing a well-defined December range.
Tactically, the 50-day moving average, currently 4,607, is followed by major support (4,545), detailed repeatedly. Both areas are also illustrated on the daily chart.
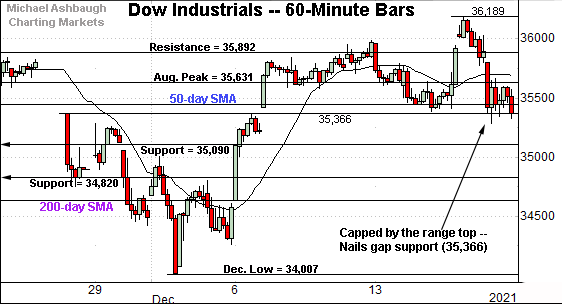
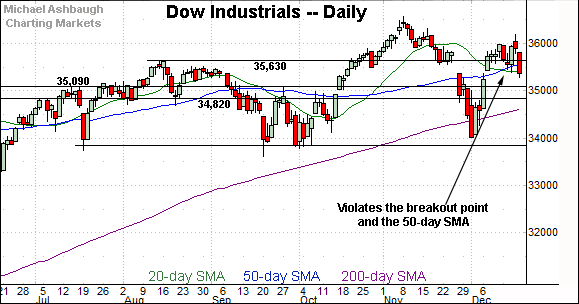
Similarly, the Dow Jones Industrial Average is traversing a familiar range.
Consider that last week’s close (35,365) matched gap support (35,366) detailed previously.
The Dow has ventured firmly under support early Monday.
Tactically, the former range top (34,820) is followed by the 200-day moving average, currently 34,621.
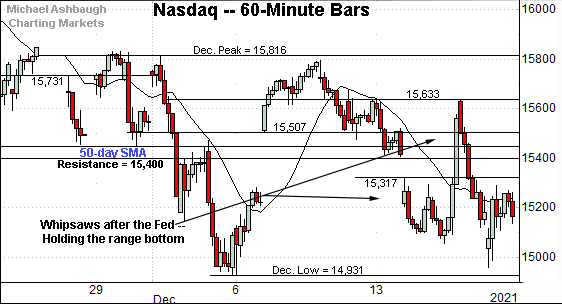
True to recent form, the Nasdaq Composite remains the weakest major benchmark.
As illustrated, the index has asserted a posture under major resistance (15,400) — a familiar bull-bear fulcrum — also illustrated below.
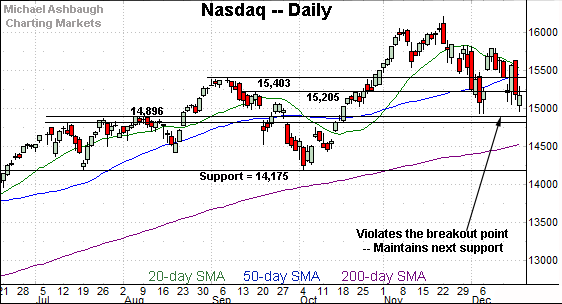
Widening the view to six months adds perspective.
On this wider view, the Nasdaq has violated its former breakout point (15,403) and the 50-day moving average.
Recall the prevailing downturn punctuates a “lower high” at the December peak raising an intermediate-term question mark.
To reiterate, deeper inflection points match the December closing low (15,085) and absolute December low (14,931). Follow-through under this area would mark a material “lower low” strengthening the bear case.
Looking elsewhere, the Dow Jones Industrial Average remains comparably stronger than the Nasdaq Composite.
Still, the index has ventured back under its breakout point (35,630) and the 50-day moving average.
Also recall that last week’s close (35,365) effectively matched gap support (35,366) detailed previously.
More immediately, the Dow has extended its downturn early Monday.
Tactically, sustained follow-through under the former range top (35,090) would raise an intermediate-term question mark.
Delving deeper, the 200-day moving average, currently 34,621, is rising within view.
Meanwhile, the S&P 500 has extended a pullback from its range top — the 4,713-to-4,718 area.
From current levels, the 50-day moving average, currently 4,607, is followed by the more important breakout point (4,545).
The bigger picture
As detailed above, the bigger-picture backdrop remains uneven amid a prolonged December volatility spike.
Amid the cross currents, potentially consequential technical tests are either within striking distance, or currently underway.
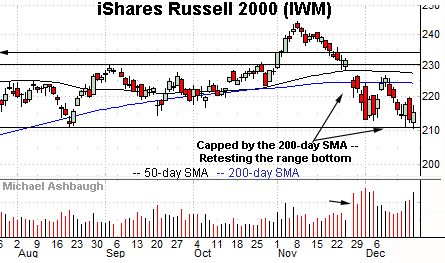
Moving to the small-caps, the iShares Russell 2000 ETF remains tenuously positioned.
Tactically, an extended test of major support — the 209.05-to-210.70 area — remains underway.
This area underpins a prolonged eight-month range. An eventual violation opens the path to a less-charted patch, and potentially material downside follow-through. (See the five-year chart.)
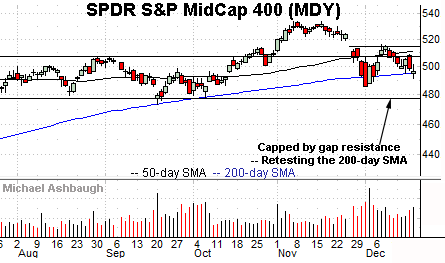
Meanwhile, the SPDR S&P MidCap 400 ETF has also registered shaky December price action.
In its case, an extended retest of the 200-day moving average, currently 495.16, remains in play.
As detailed previously, the prevailing test does not resemble the bullish reversals at the September and October lows. (Both marked single-day retests, punctuated by closes near session highs.)
Returning to the S&P 500, the chart above is a weekly view spanning 30 months. Each bar on the chart represents one week.
As illustrated, the index continues to digest a massive 12-month, 46.6% rally from the November 2020 low — (just before the U.S. election) — to the November 2021 peak.
Across this span, the S&P has registered just one weekly close slightly under its 20-week moving average, currently 4,538. (The late-September weekly close registered three points under the 20-week moving average.)
Against this backdrop, an overdue consolidation phase remains underway.
(On a granular note, the S&P’s measured move from the pandemic downdraft — defined by the early-2020 peak (3,393) and the 2020 low (2,192) — projects to 4,594. Last week’s close (4,620) registered in the vicinity.)
Returning to the six-month view, the S&P 500’s backdrop remains relatively straightforward, even amid the prevailing cross currents. Familiar inflection points stand out:
To start, the S&P’s 50-day moving average, currently 4,607, is followed by the more important breakout point (4,545).
Delving deeper, likely last-ditch support matches the December closing low (4,513) and absolute December low (4,495).
As detailed previously, an eventual violation of the 4,500 area would punctuate a double top — defined by the November and December peaks — raising the flag to a potentially consequential trend shift.
Beyond specific levels, influential sectors have reached important technical tests, partly detailed in the next section. Also recall the December market whipsaw has been punctuated by defensive sector rotation.
Amid the cross currents, the S&P 500’s intermediate-term bias remains guardedly bullish, based on today’s backdrop, though the next several sessions will likely add color.
Watch List — Traditional sector leaders reach key technical tests
Drilling down further, the traditional sector leaders — the financials, technology sector and transports — have reached notable technical tests amid the recent market whipsaw.
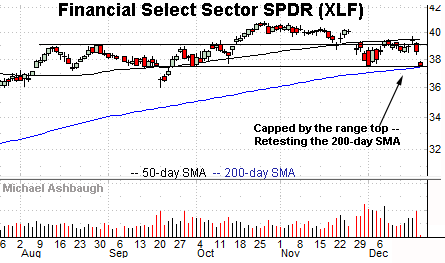
To start, the Financial Select Sector SPDR is challenging major support.
The specific area matches the 200-day moving average, currently 37.42, and the group’s three-month range bottom (37.54).
As always, the 200-day moving average is a widely-tracked longer-term trending indicator. The XLF has not closed under its 200-day since Nov. 2, 2020, just before the U.S. election.
More broadly, notice the modified head-and-shoulders top, defined by the early-October, late-October and December peaks.
A violation of the range bottom would resolve the bearish pattern — generally a high-reliability reversal pattern — opening the path to potentially material downside follow-through.
(Monday’s early session low (37.43) registered with a penny of the 200-day moving average.)
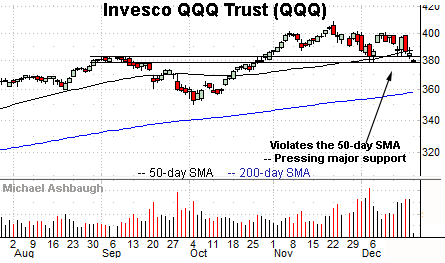
Meanwhile, the Invesco QQQ Trust tracks the Nasdaq 100 Index, and as always, serves as a large-cap technology sector proxy.
As illustrated, the QQQ is vying Monday to avoid its first close under the breakout point (382.10).
Delving slightly deeper, the December low (378.90) defines a nearly two-month range bottom.
Tactically, a violation of this area would punctuate a double top — defined by the November and December peaks — opening the path to potentially swift downside follow-through.
Against this backdrop, the December downturns have been fueled by increased volume, and punctuated by a lighter-volume intervening rally attempt. Shaky price action.
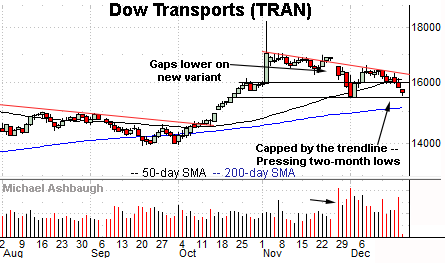
Finally, the Dow Transports are pressing two-month lows.
Tactically, the group’s December low (15,472) marks a bull-bear inflection point.
An eventual violation likely opens the path to the marquee 200-day moving average, currently 15,136.
More broadly, the transports have been pressured amid a sustained volume increase — and sluggish price action — since omicron’s emergence, the day after Thanksgiving.
Summing up the sector backdrop
Combined, the sector leaders have concurrently reached potentially consequential technical tests.
Tactically, bullish reversals from current levels would preserve a status-quo, and generally bullish-leaning, posture.
Conversely, eventual violations of major support — particularly as it applies to the financials (XLF) and large-cap technology (QQQ) — would inflict damage, strengthening the bear case. The next several sessions will likely add color.


