Charting a shaky September start: S&P 500 and Dow industrials nail major support
Focus: 10-year Treasury yield ventures above 11-year range top amid trendline breakout
Technically speaking, the major U.S. benchmarks are off to a characteristically bearish September start.
On a headline basis, each big three benchmark has violated its 50-day moving average — on the first retest — placing distance under the intermediate-term trending indicator.
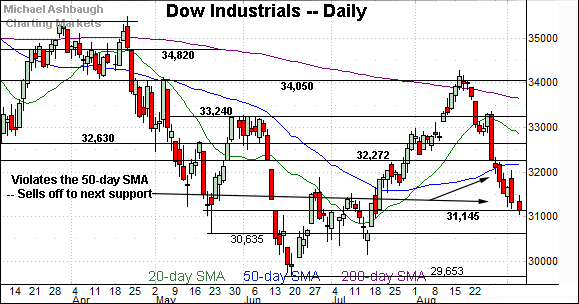
Amid the downturn, the S&P 500 and Dow industrials have effectively nailed major support — the S&P 3,900 and Dow 31,145 areas. The quality of prevailing rally attempts will likely add color.
Editor’s Note: As always, updates can be directly accessed at https://chartingmarkets.substack.com.
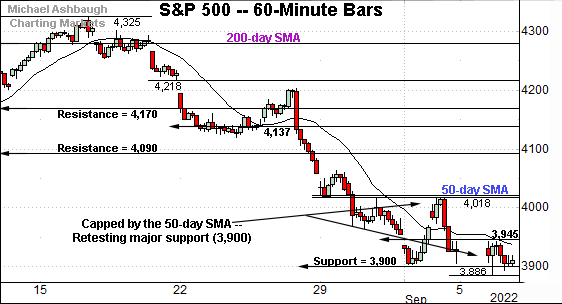
Before detailing the U.S. markets’ wider view, the S&P 500’s hourly chart highlights the past four weeks.
As illustrated, the S&P has asserted a lower plateau.
The September range has thus far been capped by the 50-day moving average, currently 4,020.
Conversely, the S&P has initially maintained major support (3,900) an area also detailed on the daily chart.
(On a granular note, the 3,945 area has marked an inflection point, detailed previously.)
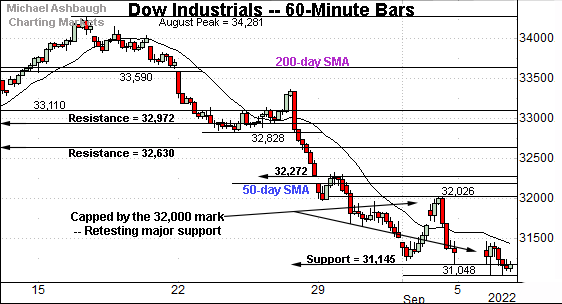
Similarly, the Dow Jones Industrial Average is traversing a lower plateau.
In its case, the 32,000 mark has effectively capped the September range.
More immediately, the subsequent downturn places major support (31,145) back in play.
Tuesday’s close (31,145) precisely matched support — an area detailed previously — and also illustrated on the daily chart.
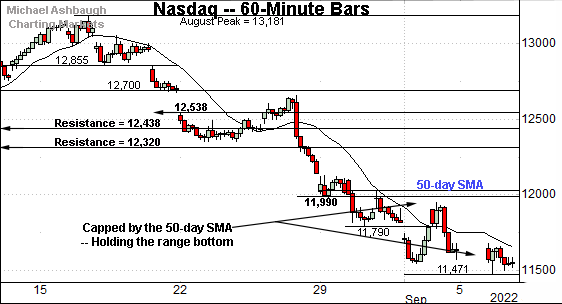
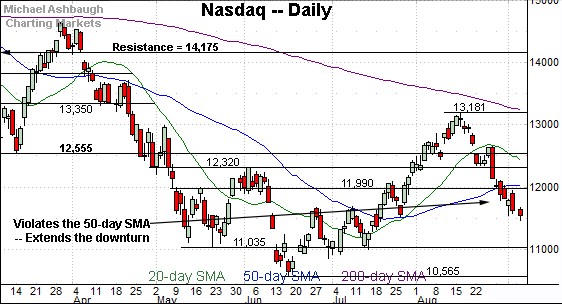
Against this backdrop, the Nasdaq Composite is also holding its range bottom.
Here again, the September range is capped by the 50-day moving average, an area also illustrated on the daily chart below.
Widening the view to six months adds perspective.
On this wider view, the Nasdaq has tagged six-week lows.
The prevailing pullback has been punctuated by downside follow-through under the 50-day moving average (12,031) to start September. As always, the 50-day is a widely-tracked intermediate-term trending indicator.
Tactically, the 11,990-to-12,030 area pivots to resistance. The pending retest from underneath may add color. (Also see the hourly chart.)
Looking elsewhere, the Dow Jones Industrial Average has also placed distance under its 50-day moving average.
Amid the downturn, the blue-chip benchmark has nailed its next significant support (31,145).
To reiterate, Tuesday’s close (31,145) matched support, an area detailed repeatedly. The quality of the rally attempt from this area may add color.
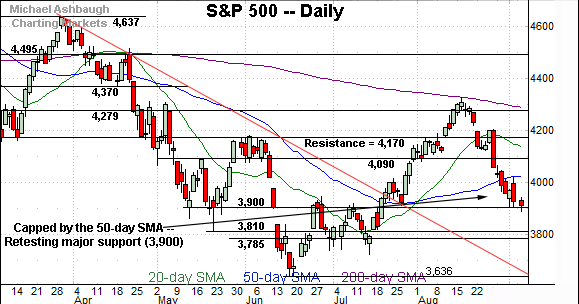
Similarly, the S&P 500 has pulled in to major support.
The specific area matches the May closing low (3,900) the June gap (also 3,900) and the early-summer range top.
More broadly, the prevailing downturn originates from the 200-day moving average, a widely-tracked longer-term trending indicator. The August peak registered within one point.
The bigger picture
As detailed above, the major U.S. benchmarks are off to a bearish September start.
On a headline basis, each big three benchmark has violated its 50-day moving average, notching five consecutive closes under the intermediate-term trending indicator.
Amid the downturn, the S&P 500 and Dow industrials have effectively nailed major support — the S&P 3,900 and Dow 31,145 areas. The quality of prevailing rally attempts may add color.
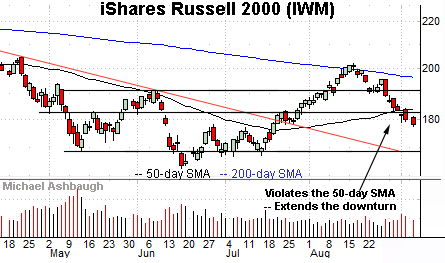
Moving to the small-caps, the iShares Russell 2000 ETF (IWM) has pulled in to its former range.
The prevailing downturn places it under the 50-day moving average, currently 183.88, amid a turn-of-the-month volume increase.
Recall the 50-day moving average roughly tracked the small-cap benchmark’s former trendline. (See the July trendline breakout.)
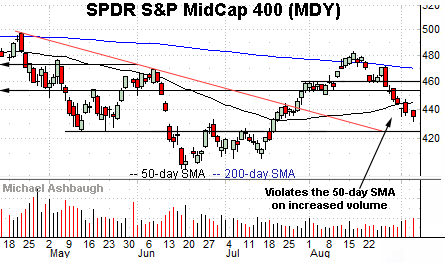
Similarly, the SPDR S&P MidCap 400 ETF (MDY) has violated its 50-day moving average to start September.
Here again, the downturn has been fueled by increased volume.
More broadly, the small- and mid-cap benchmarks have extended pullbacks from the 200-day moving average at the August peak. The primary downtrends are intact.
Returning to the S&P 500, the index has extended a downturn from the August peak.
From top to bottom, the prevailing pullback has spanned 439 points, or 10.1%, across about three weeks.
Amid the downturn, the S&P has violated major support — around 4,090 and 4,170 — as well as the 50-day moving average.
Moreover, the 50-day moving average has capped the initial rally off the September low. (Also see the hourly chart.)
Bearish price action.
Tactically, an extended retest of major support (3,900) — detailed previously — remains underway. An aggressive rally, punctuated by follow-through atop the 50-day moving average, would mark technical progress.
Beyond specific levels, the S&P 500’s intermediate- to longer-term bias remains comfortably bearish based on today’s backdrop.
Editor’s Note: Tuesday’s review was held up by a technology glitch. The next review will be published next Tuesday, Sept. 13.
Watch List
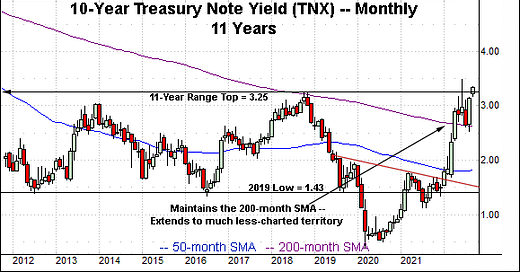
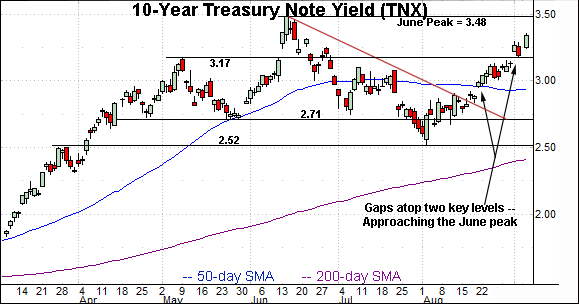
Concluding on a stray note, the 10-year Treasury note yield (TNX) has staged a potentially consequential technical event.
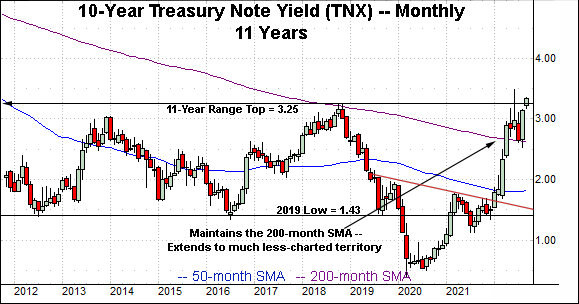
Specifically, the yield has ventured above its 11-year range top (3.25), an area illustrated on the monthly chart.
The yield has not registered a weekly close or monthly close above 3.25 since April 2011.
Against this backdrop, Tuesday’s close (3.34) registered comfortably higher, opening the path to much less-charted territory, and potentially material upside follow-through.
Tactically, the yield’s intermediate- to longer-term path of least resistance remains higher. The prevailing breakout attempt is worth tracking for potential acceleration.
(On the daily chart — above the monthly chart — the yield has extended its recent trendline breakout, gapping atop the 50-day moving average and the 3.17 inflection point. The pending retest of the June peak (3.48) is a “watch out.”)

