Charting a pulling-teeth breakout attempt, Nasdaq edges to all-time highs
Focus: S&P 500 asserts holding pattern as mid-caps challenge major resistance
Technically speaking, the major U.S. benchmarks continue to grind higher, rising amid market rotation.
Against this backdrop, each big three benchmark has registered an all-time high at some point over the prior two weeks. The charts below add color:
Editor’s Note: As always, updates can be directly accessed at chartingmarkets.substack.com.
Before detailing the U.S. markets’ wider view, the S&P 500’s hourly chart highlights the past four weeks.
As illustrated, the S&P 500 tagged a record high two weeks ago, and has since held tightly to its range top.
The sideways price action signals muted selling pressure, laying the groundwork for potential upside follow-through. Tactically, the 5,765 area marks a notable floor, as detailed previously.
Meanwhile, the Dow Jones Industrial Average has pulled in respectably from recent record highs.
Still, the downturn has thus far inflicted limited damage, in the broad sweep, as better illustrated on the daily chart. Tactically, the 42,560 area marks an overhead inflection point.
Conversely, the one-month range bottom matches major support (41,830) an area detailed previously.
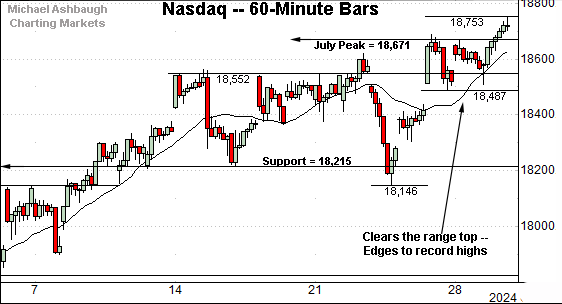
Against this backdrop, the Nasdaq Composite has tagged all-time highs, rising amid market rotation.
The prevailing upturn punctuates a relatively orderly mid-month range, effectively underpinned by familiar support (18,215).
More broadly, the Nasdaq’s breakout attempt remains underway as better illustrated below.
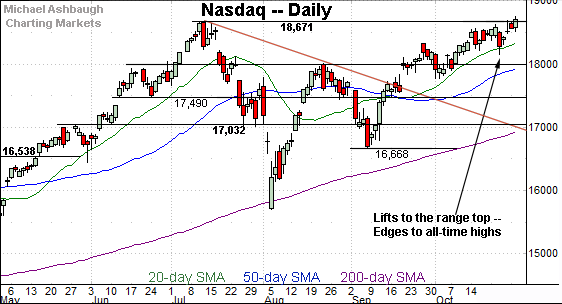
Widening the view to six months adds perspective.
On this wider view, the Nasdaq has narrowly tagged its latest record high. The prevailing upturn builds on the September trendline breakout and subsequent grinding-higher price action.
Tactically, the breakout point (18,671) is followed by the 20-day moving average, currently 18,375, a widely-tracked near-term trending indicator. (See the May-through-July uptrend, tracking atop the 20-day moving average.)
Delving deeper, the 50-day moving average, currently 17,940, is rising toward the 18,000 mark (See the August high). The Nasdaq’s intermediate-term bias remains bullish barring a violation of this area.
Looking elsewhere, the Dow Jones Industrial Average has pulled in from recent record highs.
To reiterate, the Dow’s prevailing downturn and the Nasdaq’s concurrent breakout have registered amid rotational price action.
Tactically, the 50-day moving average, currently 41,900, is closely followed by major support (41,830) — an area detailed previously — and also illustrated on the hourly chart.
Delving deeper, the September breakout point (41,376) marks a notable floor. The Dow’s intermediate-term bias remains bullish barring a violation.
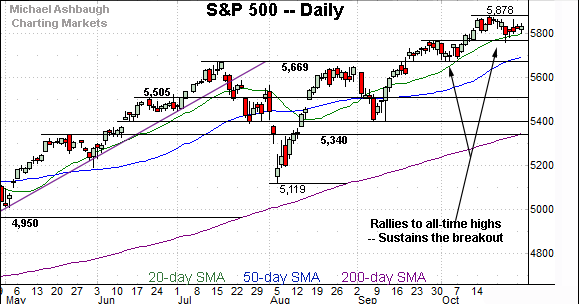
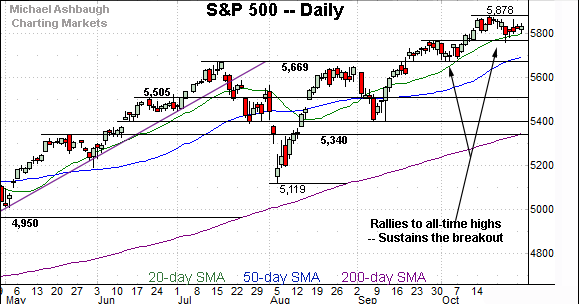
Meanwhile, the S&P 500 has sustained its early-October breakout.
The prevailing tight two-week range signals muted selling pressure near all-time highs. When sellers are absent, prices generally rise to attract new sellers.
Slighty more broadly, recall the prevailing upturn originates from major support (5,669) detailed previously.
The bigger picture
As detailed above, the U.S. benchmarks’ bigger-picture backdrop remains firmly bullish.
On a headline basis, each big three benchmark has registered an all-time high at some point over the prior two weeks, rising amid healthy rotational price action.
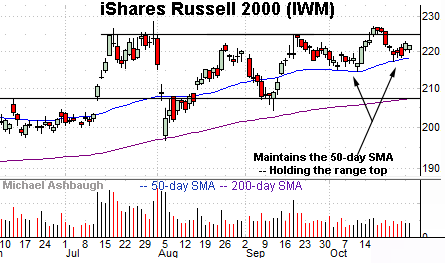
Moving to the small-caps, the iShares Russell 2000 ETF (IWM) is acting well technically.
As illustrated, the small-cap benchmark has pulled in, pressured modestly after tagging a two-year closing high. (The mid-October high.)
Tactically, the 50-day moving average, currently 218.44, continues to underpin the recent price action. A breakout attempt is in play barring a violation of this area.
Similarly, the SPDR S&P MidCap 400 ETF (MDY) has pulled in to its former range.
Nonetheless, the mid-cap benchmark has held tightly to its breakout point (the 573-to-574 area) signaling muted selling pressure near all-time highs. An extended breakout attempt remains underway.
More broadly, recall recent strength punctuates a double bottom defined by consecutive tests of the 200-day moving average at the August and September lows.
Returning to the S&P 500, its bigger-picture backdrop remains bullish, and relatively straightforward.
As illustrated, the index has asserted a tight two-week range, digesting its latest break to all-time highs.
Tactically, the 5,765 area marks a notable floor, also detailed on the hourly chart.
Delving deeper, the 50-day moving average, currently 5,697, is closely followed by major support (5,669). The S&P’s breakout originates from the October low (5,674) closely matching support. (See the Sept. 26 review.)
As always, it’s not just what the markets do, it’s how they do it.
But generally speaking, the S&P’s intermediate-term bias remains bullish to the extent it maintains a posture atop the 5,670 area. Beyond specific levels, the prevailing rotational price action remains constructive, and November starts the best six months seasonally.
Also see Oct. 17: Bull trend confirmed, S&P 500 tags latest record high.
Also see Sept. 26: Charting a technical breakout, S&P 500 tags all-time high.


