Bull trend confirmed, S&P 500 tags latest record high
Focus: Small-caps tag 35-month high, Nasdaq extends trendline breakout
Technically speaking, the U.S. benchmarks’ bigger-picture backdrop remains comfortably bullish.
On a headline basis, the S&P 500 and Dow industrials have recently tagged all-time highs, rising amid healthy market rotation. Elsewhere, the Nasdaq Composite has tagged three-month highs, extending a recent trendline breakout. The charts below add color:
Editor’s Note: As always, updates can be directly accessed at chartingmarkets.substack.com.
Before detailing the U.S. markets’ wider view, the S&P 500’s hourly chart highlights the past four weeks.
As illustrated, the S&P 500 is digesting its latest break to all-time highs.
The prevailing upturn punctuates a tight mid-October range, underpinned by the breakout point (5,765).
More broadly, the S&P’s one-month range is underpinned by major support (5,669) an area also detailed on the daily chart. (Also see the Sept. 26 review.)
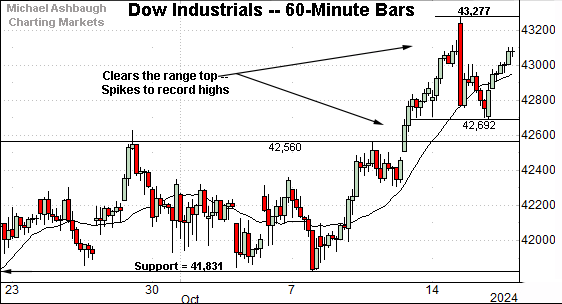
Similarly, the Dow Jones Industrial Average is digesting a break to record territory.
Tactically, the breakout point (42,560) pivots to notable support.
More broadly, the prevailing upturn originates from familiar support (41,832) detailed previously. The October low (41,831) has registered within one point.
Combined, the S&P 500 and Dow industrials have maintained well-defined support at the October low. Each has subsequently rallied to record highs.
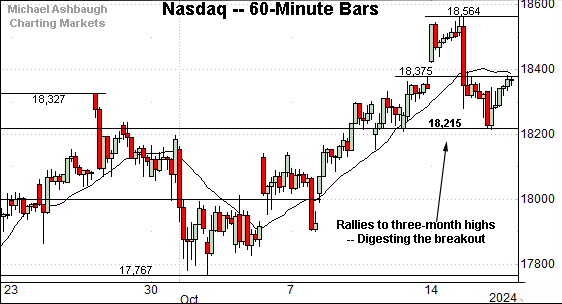
Against this backdrop, the Nasdaq Composite is digesting a rally to three-month highs amid comparably jagged price action.
Tactically, the breakout point (18,215) and the mid-month gap (18,375) mark nearby inflection points.
Widening the view to six months adds perspective.
On this wider view, the Nasdaq continues to rise, building on a September trendline breakout.
Recent strength punctuates a prolonged volatility spike, jagged price action spanning from July through September.
Tactically, the Nasdaq’s all-time high (18,671) is within view. The pending retest from underneath will likely add color. As always, the chances of a breakout improve to the extent a benchmark holds relatively tightly to resistance.
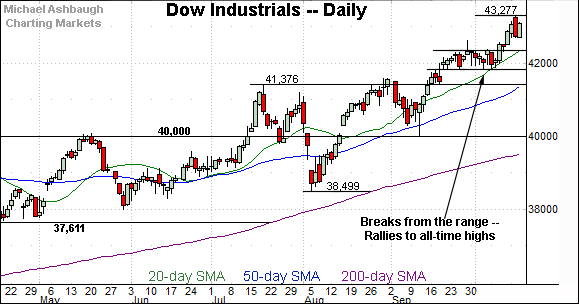
Looking elsewhere, the Dow Jones Industrial Average continues to outperform.
As illustrated, the index has tagged all-time highs, rising from a tight two-week range.
Tactically, the breakout point (42,560) pivots to support, an area better illustrated on the daily chart.
Similarly, the S&P 500 has broken out, extending to record highs.
The prevailing upturn originates from major support (5,669) detailed previously. The October low (5,674) registered within five points.
On further strength, an intermediate-term target projects from the S&P’s former range to the 5,940 area.
The bigger picture
As detailed above, the bigger-picture backdrop remains comfortably bullish.
On a headline basis, the S&P 500 and Dow industrials have recently tagged all-time highs, while the Nasdaq Composite has registered three-month highs, lagging slightly behind amid market rotation.
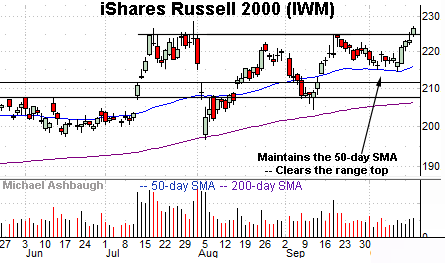
Moving to the small-caps, the iShares Russell 2000 ETF (IWM) has broken out, rising to notch its best close since Nov. 2021. (A nearly three-year closing high.)
The prevailing upturn punctuates a successful test of the 50-day moving average at the October low.
More broadly, recall the small-cap benchmark is rising from a double bottom — the W formation — underpinned by the 200-day moving average.
Tactically, a near-term target projects to the 231 area. Conversely, the breakout point, circa 224, pivots to support.
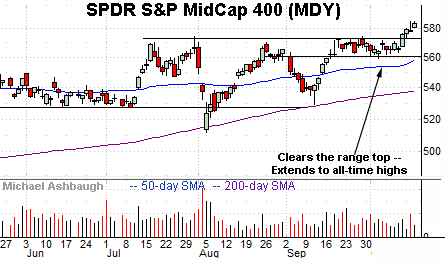
Meanwhile, the SPDR S&P MidCap 400 ETF (MDY) has broken out, rising to all-time highs from a tight three-week range.
Tactically, the breakout point (573) pivots to support.
More broadly, recent strength punctuates a double bottom defined by consecutive tests of the 200-day moving average at the August and September low. (On a detailed note, the prevailing backdrop illustrates a double bottom with platform.)
Returning to the S&P 500, its bigger-picture backdrop remains unusually straightforward.
As illustrated, the index has sustained its latest break to all-time highs.
The prevailing upturn originates from major support (5,669) an inflection point detailed previously. The October low (5,674) has registered nearby.
Delving slightly deeper, the 50-day moving average, currently 5,632, is rising toward the breakout point.
As always, it’s not just what the markets do, it’s how they do it.
But generally speaking, the S&P’s intermediate-term bias remains bullish to the extent it maintains a posture atop the 5,635-to-5,670 area. Beyond specific levels, the major U.S. benchmarks are approaching the best six months seasonally, November through April.
Also see Sept. 26: Charting a technical breakout, S&P 500 tags all-time high.


