Charting a technical breakout, S&P 500 tags all-time high
Focus: Nasdaq's trendline breakout places index at two-month highs
Broadly speaking, the major U.S. benchmarks are acting well technically, rising in the wake of a market volatility spike.
Against this backdrop, the S&P 500 and Dow industrials have tagged all-time highs, while the Nasdaq Composite has cleared a key trendline, reaching two-month highs. The charts below add color:
Editor’s Note: As always, updates can be directly accessed at chartingmarkets.substack.com.
Before detailing the U.S. markets’ wider view, the S&P 500’s hourly chart highlights the past four weeks.
As illustrated, the S&P 500 has sustained a recent break to all-time highs.
Tactically, the breakout point (5,669) pivots to well-defined support, an area also detailed on the daily chart.
Similarly, the Dow Jones Industrial Average is digesting a break to record territory.
The tight five-session range signals still muted selling pressure near all-time highs.
Slightly more broadly, the prevailing upturn originates from the September low, a level closely matching the 40,000 mark.
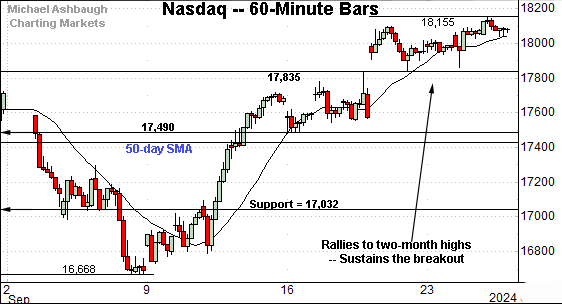
Against this backdrop, the Nasdaq Composite has reached two-month highs.
Like the other benchmarks, the index has asserted a five-session flag-like pattern, digesting the recent breakout.
Tactically, near-term support (17,835) is followed by a firmer floor around the 17,500 mark.
Widening the view to six months adds perspective.
On this wider view, the Nasdaq seems to be making technical progress.
To start, the index has cleared trendline resistance — and the 50-day moving average — raising the flag to an intermediate-term trend shift.
Moreover, the index has registered a “higher high” versus the August peak, also consistent with a trend shift.
Tactically, the 50-day moving average, currently 17,420, is starting to loosely track the former trendline. A sustained posture atop this area signals a bullish intermediate-term bias.
(On a granular note, the Nasdaq has registered five straight sessions in which the session open and session close have closely matched. This signals hesitation, or indecision, as to the near-term trend. A bull-bear stalemate at nominal two-month highs.)
Looking elsewhere, the Dow Jones Industrial Average continues to outpace the Nasdaq Composite.
As illustrated, the index has reached all-time highs, clearing resistance matching the July and August peaks. The prevailing upturn originates from major support closely matching the 40,000 mark.
From current levels, the breakout point — broadly speaking, the 41,375-to-41,585 area — pivots to support.
Similarly, the S&P 500 is digesting a recent rally to record highs.
Here again, the breakout point — in this case, the 5,650-to-5,670 area — pivots to notable support.
The bigger picture
As detailed above, the major U.S. benchmarks are acting well technically, on balance.
On a headline basis, the S&P 500 and Dow industrials have reached all-time highs, while the Nasdaq Composite continues to lag behind, though it has signaled a trend shift, tagging two-month highs.
Combined, the bigger-picture backdrop is not one-size-fits-all, though the market technicals are broadly bullish.
Moving to the small-caps, the iShares Russell 2000 ETF (IWM) is showing signs of life, rising in the wake of a volatile three months.
The September rally has effectively nailed the range top, a move punctuated by an orderly pullback, amid decreased volume.
More broadly, the small-cap benchmark is rising from a double bottom — the W formation — underpinned by the 200-day moving average.
Tactically, an eventual rally atop the 224 area could open the path to a decisive breakout. (See the mid-July strong-volume spike.)
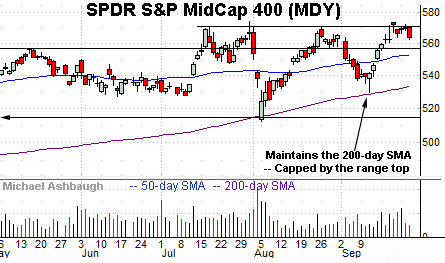
Similarly, the SPDR S&P MidCap 400 ETF (MDY) is showing signs of life technically.
Here again, the mid-cap benchmark is rising from a double bottom, a pattern defined by consecutive tests of the 200-day moving average.
Tactically, an eventual rally atop the 570-to-573 area opens the path to all-time highs, and potentially material upside folllow-through. (By comparison, the Russell 2000 is vying to tag two-year highs.)
Returning to the S&P 500, its bigger-picture backdrop remains relatively straightforward.
As illustrated, the index is digesting a recent break to record territory. The prevailing bull flag — the tight five-session range — signals still muted selling pressure near all-time highs.
Tactically, the breakout point — the 5,650-to-5,670 area — pivots to notable support.
Delving deeper, the 50-day moving average, currently 5,526, roughly matches support at 5,505.
And on further weakness, the 5,400 mark represents a more important floor. This area matches the Sept. low (5,402), the July closing low (5,399) and the June gap.
As always, it’s not just what the markets do, it’s how they do it.
But generally speaking, the S&P’s intermediate-term bias remains bullish to the extent it maintains the 5,400 area. Beyond technical levels, the S&P 500 has registered a record high to conclude what is statistically the worst month seasonally.
Also see Sept. 12: Market cross currents persist, Nasdaq rises to challenge key trendline.


