


Charting a bull-bear battle, S&P 500 reaches contested zone
Focus: Nasdaq, S&P 500 reclaim 50-day moving average

Technically speaking, the major U.S. benchmarks have staged an impressive rally from the April low.
Amid the upturn, the S&P 500 has reached a risk-reward neutral zone, as well as a Rorschach test, of sorts, for the bull-bear debate. The charts below add color:
Editor’s Note: As always, updates can be directly accessed at chartingmarkets.substack.com.
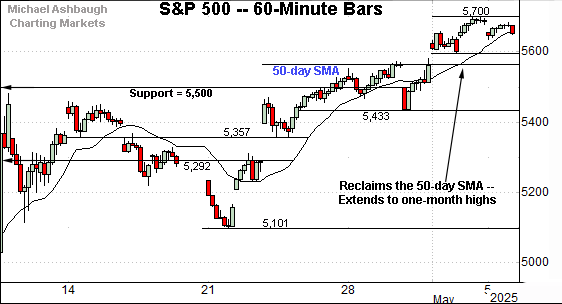
Before detailing the U.S. markets’ wider view, the S&P 500’s hourly chart highlights the past four weeks.
As illustrated, the S&P 500 has rallied to one-month highs.
In the process, the index has reclaimed its 50-day moving average, currently 5,568, a widely-tracked intermediate-term trending indicator. (This marks its first closes atop the 50-day moving average since Feb. 21.)
Tactically gap support (5,597) is closely followed by the 50-day moving average. Delving deeper, a firmer floor matches the 5,500 mark.
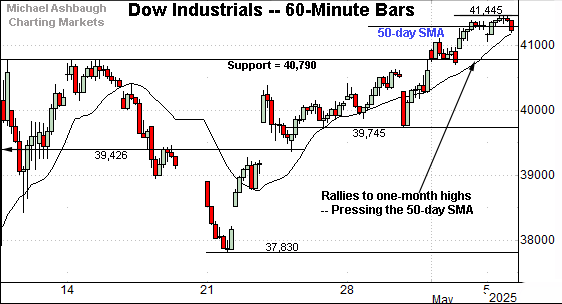
Meanwhile, the Dow Jones Industrial Average has also tagged one-month highs, rising amid a strong May start.
The prevailing upturn places its 50-day moving average, currently 41,195, under siege.
Tactically, the May breakout point (40,790) pivots to notable support.
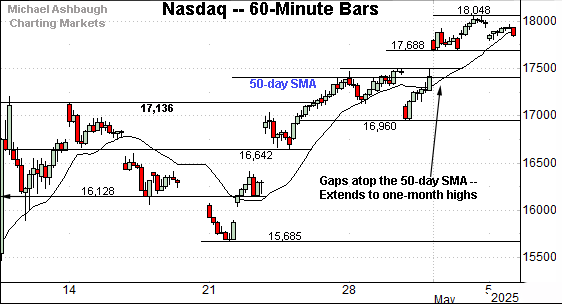
Against this backdrop, the Nasdaq Composite has also reached one-month highs.
Tactically, gap support — at 17,688 and 17,500 — is closely followed by the 50-day moving average, currently 17,430.
Combined, each big three U.S. benchmark has staged an early-May rally, rising to reclaim notable levels.
Widening the view to six months adds perspective.
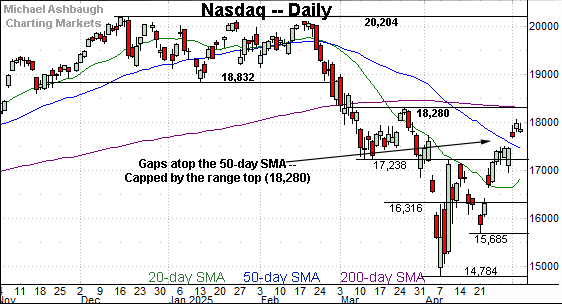
On this wider view, the Nasdaq has extended its rally from the April low.
The prevailing upturn places significant resistance within view. Two areas stand out:
The 200-day moving average, currently 18,315.
The two-month range top (18,280).
Tactically, eventual follow-through atop these areas would signal a bullish longer-term bias. The pending retest from underneath is worth tracking.
Conversely, downside support matches the 50-day moving average, currently 17,430, and is followed by the early-April range top (17,238). The Nasdaq’s recovery attempt is intact barring a violation of these areas.
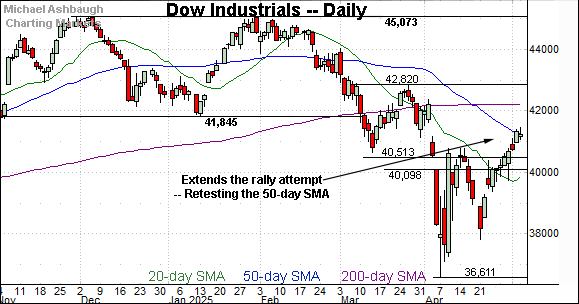
Looking elsewhere, the Dow Jones Industrial Average has also whipsawed amid less-charted territory.
Recall the Dow’s March downdraft punctuated a double top — the M formation — defined by the December and January peaks.
More immediately, the index is challenging its 50-day moving average, currently 41,195.
Tactically, the 40,500 area underpins the Dow’s prevailing range. The blue-chip benchmark’s recovery attempt is intact barring a violaton of this area.
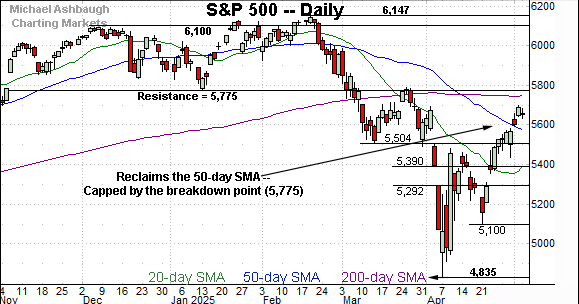
Meanwhile, the S&P 500 has staged a slightly stronger rally from recent lows, rising atop its 50-day moving average to start May.
More broadly, the prevailing upturn originates from major support (4,835), a familiar area detailed in the next section.
The bigger picture
As detailed above, the major U.S. benchmarks have staged an impressive rally off the April low. From bottom to top:
The Dow industrials have rallied as much as 4,834 points, or 13.2%, from the April low.
The Nasdaq Composite has risen as much as 3,265 points, or 22.1%, from the April low.
The S&P 500 has rallied as much as 866 points, or 17.9%, from the April low.
The prevailing upturn punctuates a massive market whipsaw and prolonged two-month volatility spike.
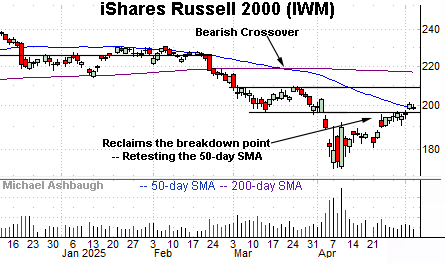
Moving to the small-caps, the iShares Russell 2000 ETF (IWM) has extended its recovery attempt.
In the process, the small-cap benchmark has reclaimed its breakdown point (197) rising to challenge the 50-day moving average, currently 198.06.
Tactically, a sustained posture atop the breakdown point (197) signals the recovery attempt is intact.
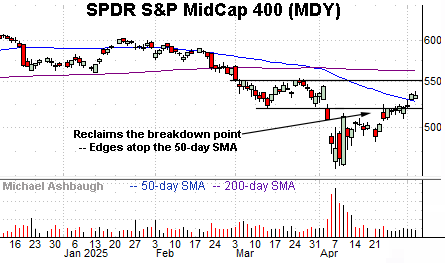
Similarly, the SPDR S&P MidCap 400 ETF (MDY) has extended its reversal from the April low.
In this case, the mid-cap benchmark has reclaimed its breakdown point (520) and the 50-day moving average, currently 527.40. Both areas pivot to support.
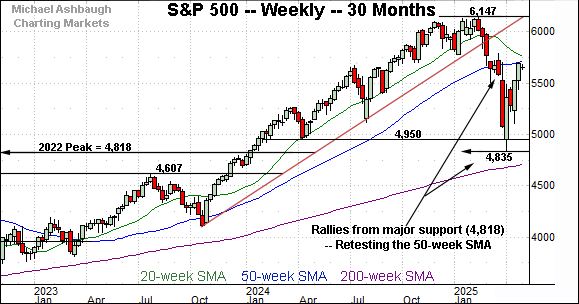
Returning to the S&P 500, this next chart is a weekly view spanning 30 months. Each bar on the chart represents one week.
As illustrated, the S&P has rallied sharply from major support.
Recall the April low (4,835) registered slightly above an important floor matching the 2022 peak (4,818). (See the April 23 review.)
Amid the upturn, the index has reached its 50-week moving average, currently 5,704. Notice the initial trendline violation hesitated near the 50-week moving average before ultimately extending aggressively lower. (The mid-March weekly close registered within two points of the 50-week SMA.)
So the response to this area — the 5,700 area — may be a useful bull-bear gauge. The prevailing rally has thus far topped precisely at 5,700.

Returning to the S&P 500’s six-month view adds perspective.
As illustrated, the index has rallied sharply from the April low. In the process, the S&P has reached a risk-reward neutral zone, as well as a Rorschach test, of sorts, for the bull-bear debate. Market bulls and bears might see a different landscape.
When gauging the prevailing backdrop, two general areas stand out.
Starting with support, the S&P has reclaimed its 50-day moving average, currently 5,568, as well as an inflection point matching the 5,500 mark. The prevailing recovery attempt is intact barring a violation of these areas.
Conversely, two overhead technical levels remain in play:
The 200-day moving average, currently 5,746.
The breakdown point (5,775), a level formerly defining the post-election low.
As detailed previously, the cross section of these areas — the 5,750-to-5,775 area — marks a longer-term bull-bear fulcrum. (Also see the April 23 review.)
So collectively, the S&P’s a near-term recovery attempt remains underway. Market bulls are on offense, for the near-term, barring a violation of the 5,500 area. (Also see the hourly chart.)
More broadly, the S&P’s sustained posture under major resistance — the 5,775 inflection point — continues to signal a bearish longer-term bias. The pending response to each area, potentially across the next few weeks, will likely add color.
Also see April 23: Charting a corrective bounce, S&P 500 extends potentially viable rally attempt.