Bull case strengthens amid stealth 9-to-1 up day ahead of Fed
Focus: Apple presses key trendline ahead of earnings, XLF, AAPL, T, NUE, STX
Technically speaking, the major U.S. benchmarks have extended an early-year rally attempt, rising amid market rotation.
In the process, the S&P 500 has extended its trendline breakout, while the Nasdaq Composite has concurrently ventured atop its 200-day moving average. Both events place a potential longer-term trend shift in play.
Editor’s Note: As always, updates can be directly accessed at https://chartingmarkets.substack.com.
Before detailing the U.S. markets’ wider view, the S&P 500’s hourly chart highlights the past four weeks.
As illustrated, the S&P has extended its rally attempt, tagging six-week highs.
Tactically, near-term support (4,015) is followed by the more important 200-day moving average, currently 3,952.
(Also note the 50-day moving average (3,948) and 200-day moving average (3,952) closely match.)
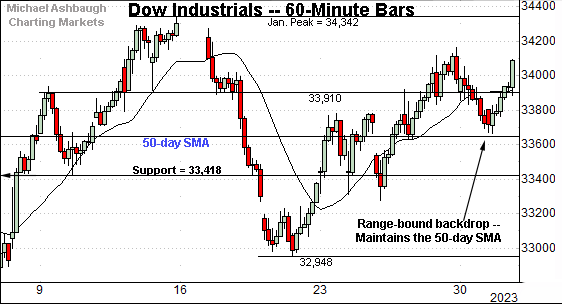
Meanwhile, the Dow Jones Industrial Average remains range-bound.
Within the range, the index has maintained its 50-day moving average, currently 33,650. (The week-to-date low (33,664) has registered nearby.)
Delving deeper, the 33,420 area remains a notable floor.
Against this backdrop, the Nasdaq Composite continues to strengthen, tagging four-month highs.
In the process, the index has ventured atop its 200-day moving average, currently 11,478.
More broadly, the Nasdaq’s sustained resurgence — versus the range-bound Dow industrials — continues to signal rotational price action.
Widening the view to six months adds perspective.
On this wider view, the Nasdaq has tagged four-month highs, rising to challenge the 200-day moving average, currently 11,478.
In the process, the index has registered its first close atop the 200-day moving average since Jan. 14, 2022.
As always, the 200-day is a widely tracked longer-term trending indicator. Sustained follow-through atop this area would raise the flag to a primary trend shift.
Separately, the former range top (11,492) remains an inflection point.
So broadly speaking, the Nasdaq is vying to break from the 11,478-to-11,492 area.
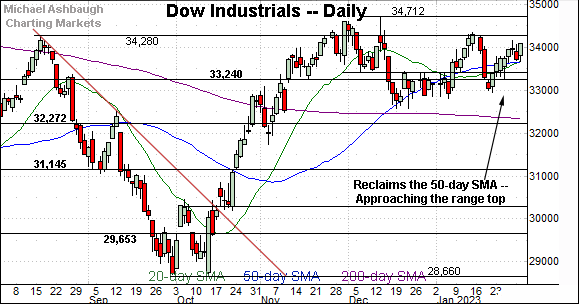
Looking elsewhere, the Dow Jones Industrial Average remains the strongest major benchmark on this wider view.
Still, the Dow has not tagged four-month highs, along with the Nasdaq, amid recently rotational market price action.
Tactically, the 50-day moving average, currently 33,650, is followed by support broadly spanning from about 33,240 to 33,420.
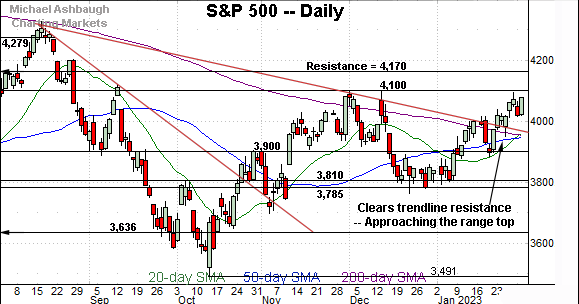
Meanwhile, the S&P 500 has extended its recent trendline breakout.
The prevailing upturn places major resistance (4,100) firmly within view. Recall the 4,100 mark capped two aggressive early-December spikes that, at the time, dovetailed with trendline tests.
Separately, notice the pending golden cross, or bullish 50-day/200-day moving average crossover. Though frequently a lagging indicator, the crossover signals the intermediate-term uptrend has overtaken the longer-term trend.
The bigger picture
As detailed above, the bigger-picture technicals continue to strengthen though amid a backdrop that is not one-size-fits-all.
On a headline basis, the S&P 500 has extended its trendline breakout, while the Nasdaq Composite has ventured atop its 200-day moving average.
Both events place a potential longer-term trend shift in play. The rally’s durability and follow-through remain to be seen at this still relatively early stage.
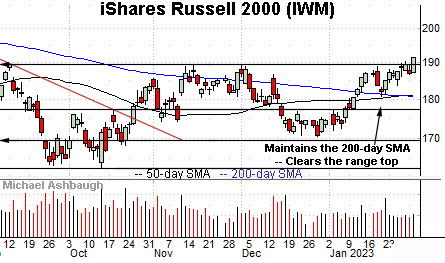
Moving to the small-caps, the iShares Russell 2000 ETF (IWM) has narrowly broken out, edging to five-month highs.
Tactically, the breakout point — the 189.55-to-189.90 area — pivots to support.
Delving deeper, the 50- and 200-day moving averages mark nearby inflection points. Recall the recent golden cross, detailed last week.
Meanwhile, the SPDR S&P MidCap 400 ETF (MDY) has broken out more decisively.
In the process, the MDY has tagged nine-month highs, building on last week’s breakout amid a volume spike.
Tactically, the former range top (475.15) is followed by support, circa 472.40.
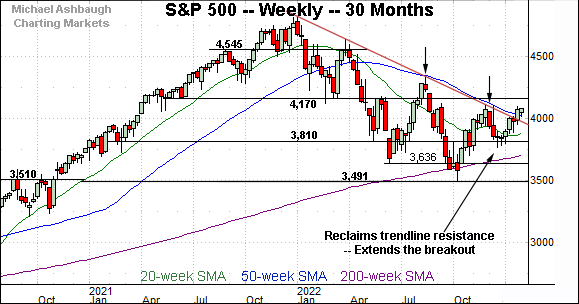
Returning to the S&P 500, this next chart is a weekly view spanning 30 months. Each bar on the chart represents one week.
As illustrated, the S&P 500 has extended its trendline breakout, notching its first weekly close higher in nearly 13 months. The index is vying this week to notch a second straight weekly close atop the trendline, an event that would incrementally strengthen the bull case.
On further strength, the 4,100 mark is followed by major resistance at 4,170.
(On a granular note, recall the trendline roughly tracks the 50-week moving average, currently 4,025.)
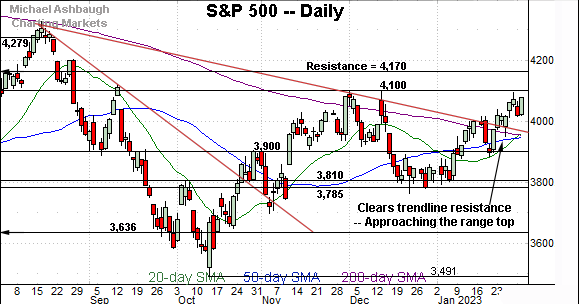
Narrowing to the S&P 500’s six-month view adds perspective.
On this daily chart, the S&P 500 has also extended its recent trendline breakout. Recall the trendline roughly tracks the 200-day moving average, and is hinged to the S&P’s all-time high.
Amid the upturn, Friday’s weekly close atop the trendline, has been closely followed by Tuesday’s monthly close higher. Bullish developments.
Moreover, Tuesday’s monthly close registered, perhaps surprisingly, as a stealth 9-to-1 up day. Specifically, NYSE advancing volume surpassed declining volume by a 9-to-1 margin.
As always, in a textbook world, two 9-to-1 up days — across about a seven-session window — reliably signals a material trend shift. (The early-2019 rally originated from two 9-to-1 up days across a precisely seven-session window.)
Put differently, the bull case has strengthened — for an early-year rally that previously registered mixed marks for style — though the backdrop remains less than picture-perfect. A comparably aggressive singe-day rally, over about the next week, would place the trend shift on firmer footing.
Against this backdrop, the S&P 3,950 area pivots to important support.
This area matches last week’s low (3,949) — also the post-breakout low (3,949) — as well as the 50-day moving average (3,948) and 200-day moving average (3,952).
Tactically, the S&P 500’s rally attempt is intact barring a violation of the 3,950 area. The markets’ response to the Federal Reserve’s policy language — over the next few sessions — will likely add color.
(On a granular note, much of the bullish internal progress fueling Tuesday’s monthly close registered during the session’s final 15 minutes amid a volume spike. Market bears might contend the very month-end volume spike lends the 9-to-1 up day an engineered quality. The price action is nonetheless technically bullish.)
Editor’s Note: The next review will be published Tuesday, Feb. 7.
Watch List
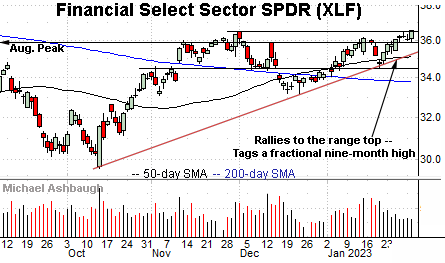
Drilling down further, the Financial Select Sector SPDR (XLF) — detailed last week — continues to challenge major resistance.
In fact, the group has tagged a fractional nine-month high, edging atop resistance broadly spanning from about 36.00 to 36.50. (To be specific, the week-to-date peak (36.57) has eclipsed the Dec. peak (36.49) by just eight cents.)
Tactically, trendline support is closely followed by the 50-day moving average, currently 35.14. A breakout attempt is in play barring a violation.
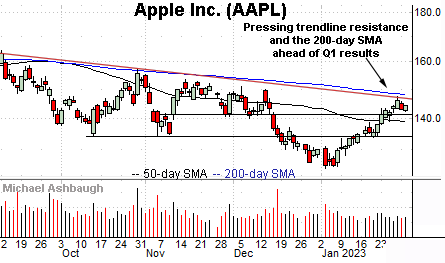
Moving to specific names, Dow 30 component Apple Inc. (AAPL) has reached a headline technical test.
Specifically, the shares are approaching trendline resistance roughly tracking the 200-day moving average, currently 147.92. Sustained follow-through atop this area would raise the flag to a longer-term trend shift.
Against this backdrop, the response to the company’s quarterly results — due out after the close Thursday, Feb. 2 — will likely add color. Tactically, the breakout attempt is intact barring a violation of the former range bottom (141.10).
AT&T, Inc. (T) is a well positioned large-cap name. (Yield = 5.5%.)
Late last month, the shares gapped to six-month highs, rising after the company’s well received fourth-quarter results. The prevailing upturn originates from trendline support closely matching the 200-day moving average.
Tactically, gap support (19.74) is closely followed by the breakout point (19.55). The prevailing rally attempt is intact barring a violation.
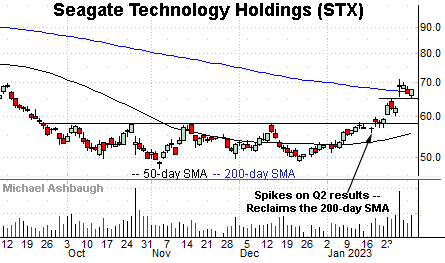
Looking elsewhere, Seagate Technology Holdings (STX) is a large-cap developer of data-storage solutions. (Yield = 4.1%.)
As illustrated, the shares have recently knifed atop the 200-day moving average, rising amid a volume spike after the company’s strong quarterly results.
By comparison, the subsequent pullback has been orderly, placing the shares 4.8% under the January peak. Tactically, a sustained posture atop the 64.90 area signals a bullish bias.
Finally, Nucor Corp. (NUE) is a well positioned large-cap steel producer.
The shares initially spiked last week, knifing to nine-month highs after the company’s fourth-quarter results.
The subsequent bull flag — (the tight three-session range) — is a continuation pattern, positioning the shares to build on the initial spike. Tactically, the rally attempt is intact barring a violation of the breakout point (159.60).
More broadly, the shares are well positioned on the five-year chart (not illustrated) rising within striking distance of all-time highs.


