


Charting a modest June breakout, Nasdaq reaches higher plateau
Focus: Smalls and mid-caps remain capped by 200-day average

Technically speaking, the S&P 500 and Nasdaq Composite have registered modest June breakouts, tagging three-month highs.
In the process, each benchmark has asserted a higher plateau amid a still bullish bigger-picture backdrop. The charts below add color:
Editor’s Note: As always, updates can be directly accessed at chartingmarkets.substack.com.
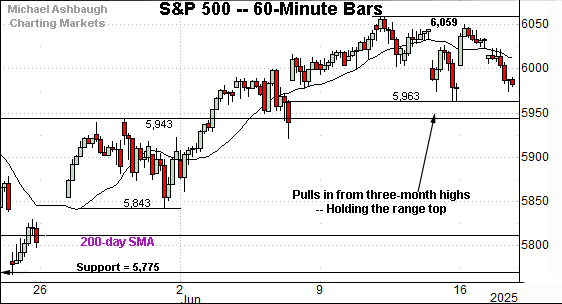
Before detailing the U.S. markets’ wider view, the S&P 500’s hourly chart highlights the past four weeks.
As illustrated, the S&P 500 is holding its range top amid a modest pullback from three-month highs. Tactically, the 5,943-to-5,963 area marks a notable near-term floor.
More broadly, the prevailing upturn originates from major support (5,775), an area also detailed on the daily chart.

Meanwhile, the Dow Jones Industrial Average continues to lag slightly behind.
The prevailing pullback places the index back under its 200-day moving average, currently 42,518, a widely-tracked longer-term trending indicator.
Separately, the Dow remains capped by major resistance (42,280) an area better illustrated on the daily chart.
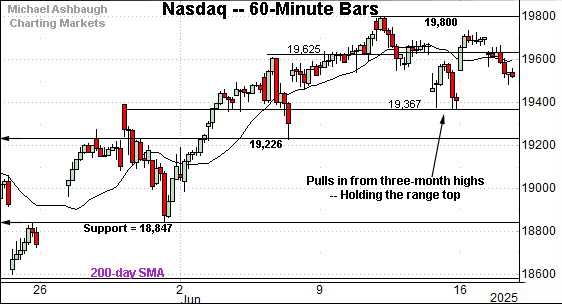
Against this backdrop, the Nasdaq Composite is acting well technically.
As illustrated, the index is holding its range top amid a thus far tame pullback from three-month highs.
Slightly more broadly, the prevailing upturn originates from major support — the 18,830-to-18,847 area — also detailed on the daily chart below.
Collectively, the Nasdaq Composite and S&P 500 have asserted a higher June plateau. The sustained breakouts, though admittedly unspectacular, are nonetheless constructive.
Widening the view to six months adds perspective.
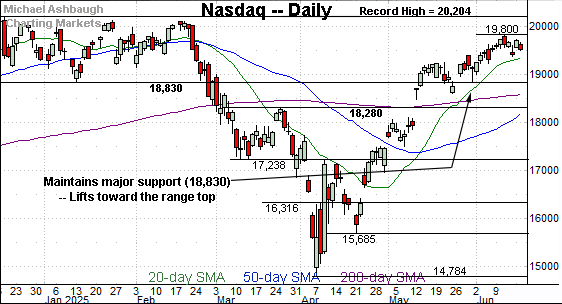
On this wider view, the Nasdaq’s backdrop remains bullish.
Recall the index knifed atop its 200-day moving average amid an early-May breakout.
More immediately, the Nasdaq has stabilized within its early-2025 range. To reiterate, the early-June upturn originates from major support (18,830), an area defining the former range bottom.
Tactically, a sustained posture atop the 18,830 area signals a bullish intermediate- to longer-term bias.

Looking elsewhere, the Dow Jones Industrial Average continues to lag behind the other benchmarks.
As illustrated, the index remains capped by its range top (42,280) — a level matching the late-March peak — unlike the Nasdaq and the S&P 500.
Separately, the Dow has ventured back under its 200-day moving average, currently 42,518, amid an extended June retest.
Elsewhere, the S&P 500 and Nasdaq concurrently cleared both levels — the 200-day moving average and their respective range top — across a single session. Both have since placed distance firmly atop each area.
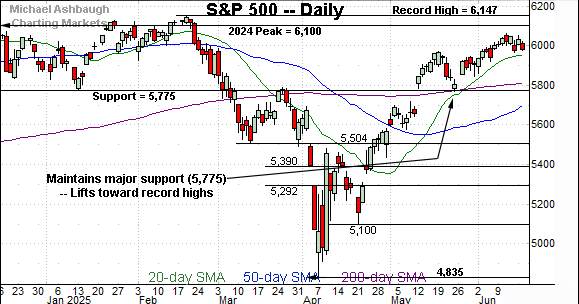
Meanwhile, the S&P 500’s backdrop remains more firmly bullish.
As illustrated, the decisive May breakout has been punctuated by a successful test of major support (5,775). The subsequent grinding-higher June rally places the 2024 peak (6,100) within view.
Separately, the S&P 500 and Nasdaq Composite have rallied firmly atop the 200-day moving average outpacing the other benchmarks.
The bigger picture
As detailed above, the U.S. benchmarks’ bigger-picture backdrop remains bullish.
On a headline basis, the S&P 500 and Nasdaq Composite have sustained modest June breakouts, asserting a higher plateau. (See the hourly charts.)
In both cases, the grinding-higher price action orginates from major support — S&P 5,775 and Nasdaq 18,830. (See the daily charts.)
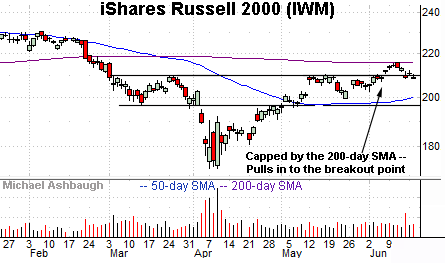
Moving to the small-caps, the iShares Russell 2000 ETF (IWM) continues to lag behind the major benchmarks.
As illustrated, the small-cap benchmark has stalled at its 200-day moving average, currently 215.70.
The subsequent pullback toward the breakout point (210.10) has thus far been orderly.
More broadly, recall the head-and-shoulders bottom, a bullish pattern defined by the March, April and late-May lows. Tactically, eventual follow-through atop the 200-day moving average would raise the flag to a longer-term trend shift.
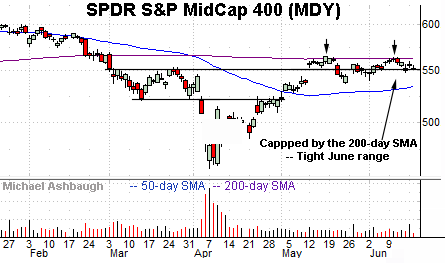
Similarly, the SPDR S&P MidCap 400 ETF (MDY) is lagging behind the broader markets.
Here again, the mid-cap benchmark remains capped by its 200-day moving average, currently 563.14.
Nonetheless, the tight June range signals limited selling pressure near resistance, laying the groundwork for a potential breakout. Tactically, a breakout attempt is in play barring a violation of the 547.00-to-548.50 area.
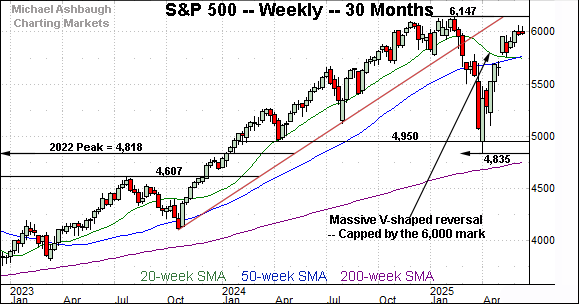
Returning to the S&P 500, this next chart is a weekly view spanning 30 months. Each bar on the chart represents one week.
As illustrated, the S&P has rallied sharply from major support amid a massive V-shaped reversal.
Recall the April low (4,835) registered slightly above an important floor matching the 2022 peak (4,818). (See the April 23 review.)
Amid the upturn, the index has reclaimed its 50-week moving average, currently 5,767, closing atop this area across six straight weeks.
But against this bullish backdrop, the S&P has yet to register a weekly close atop the 6,000 mark. The early-June weekly close precisely matched the 6,000 mark, and the index has since held tightly to the round number.
Collectively, the S&P 500’s weekly view remains comfortably bullish, based on today’s backdrop.

Returning to the S&P 500’s six-month view adds perspective.
As illustrated, the S&P has stabilized in recent weeks amid a sluggish June rally. Nonetheless, boring is bullish against the prevailing backdrop.
More broadly, the index has reasserted a posture atop two familiar — and technically significant — inflection points:
The 200-day moving average, currently 5,812.
The breakdown point (5,775), a level formerly defining the post-election low.
As detailed repeatedly, the cross section of these areas — call it the 5,775-to-5,800 area — marks a longer-term bull-bear fulcrum. (Also see the April 23 review.)
Moreover, the S&P has successfully retested this area as support. The mid-May low (5,767) registered nearby, and the index has subsequently rallied toward the range top.
Beyond specific levels, the May breakout punctuated a bullish V-shaped reversal from the April low. Also recall the initial rally off the lows registered unusually bullish breadth in the form of two 9-to-1 up days. (See the April 23 review.)
Collectively, the S&P 500 has sustained its recent break to firmer technical ground. The prevailing backdrop supports a bullish longer-term bias barring a violation of the 5,775-to-5,800 area.
Also see June 4: Charting a slow-motion breakout attempt, S&P 500 edges to three-month high.