Charting a market headwind: Surging commodity prices contribute to technical damage
Focus: Commodity prices take flight amid geopolitical tensions, WEAT, CORN, USO, GLD, SLV, GDX
Technically speaking, the major U.S. benchmarks are back on the defensive, pressured as prolonged geopolitical tensions continue to inflict damage.
Amid the uncertainty, commodity prices have taken flight, presenting an already firmly-bearish market backdrop with an added headwind.
Editor’s Note: As always, updates can be directly accessed at https://chartingmarkets.substack.com.
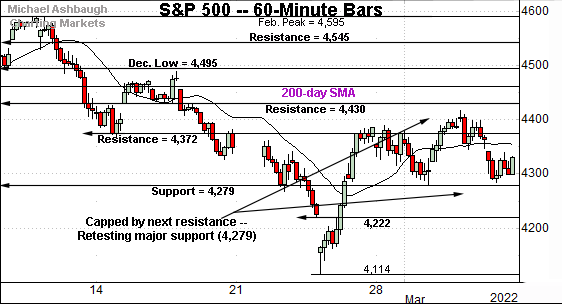
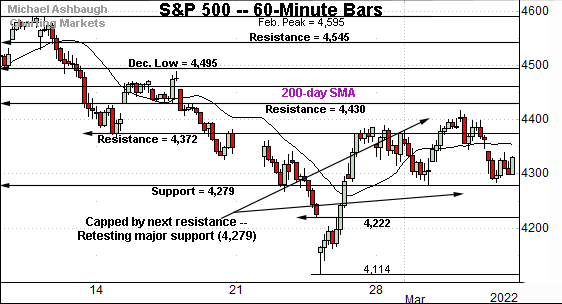
Before detailing the U.S. markets’ wider view, the S&P 500’s hourly chart highlights the past four weeks.
As illustrated, the S&P has pulled in to a potentially consequential technical test.
Specifically, the index is retesting major support (4,279), an area that twice held last week. Consider that last week’s low (4,279.5) precisely matched support.
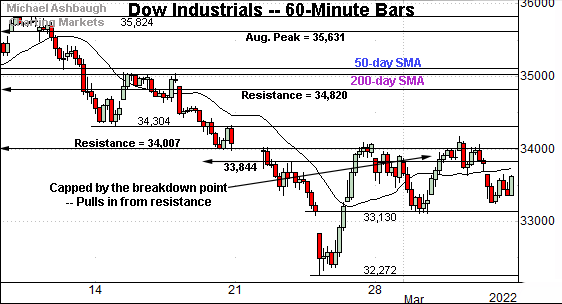
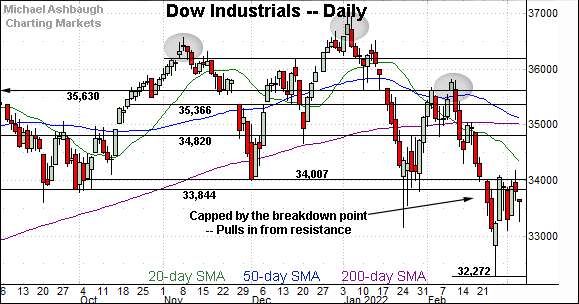
Meanwhile, the Dow Jones Industrial Average has failed a headline test.
Specifically, the index has struggled to reclaim its breakdown point (34,007) a key bull-bear fulcrum detailed previously.
The prevailing pullback places familiar support (33,130) back in play.
Monday’s early session low (33,125) registered nearby.
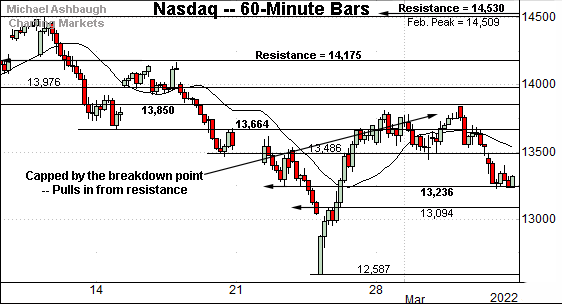
Similarly, the Nasdaq Composite has failed a notable technical test.
In its case, the index has struggled to reclaim the 13,850 resistance, an area also illustrated below.
Last week’s high (13,837) registered slightly under resistance, and relatively pronounced selling pressure has subsequently surfaced.
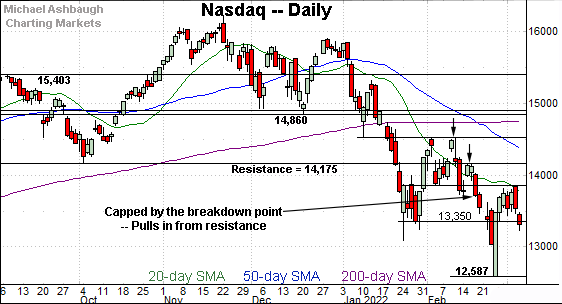
Widening the view to six months adds perspective.
On this wider view, consider two headline inflection points, detailed last week.
To start, the Nasdaq has stalled at the mid-February breakdown point (13,850), an area marking its first notable overhead. Last week’s high (13,837) registered slightly under resistance.
More immediately, the Nasdaq has violated the 13,350 support.
Monday’s early session high (13,353) has matched this area to punctuate a failed retest from underneath.
Tactically, the violation of the 13,350 area — and failed retest from underneath — likely wrecks its recovery attempt. The Nasdaq’s more important intermediate- to longer-term bias remains firmly bearish.
Looking elsewhere, the Dow Jones Industrial Average has also failed a headline technical test.
Recall the Dow’s recent downdraft punctuates a head-and-shoulders top, defined by the November, January and February peaks.
The subsequent rally attempt has been capped by the breakdown point (34,007), a key bull-bear fulcrum detailed repeatedly.
The failed retest from underneath preserves a firmly-bearish intermediate- to longer-term bias.
On a granular note, notice the pending death cross — or bearish 50-day/200-day moving average crossover — an event that will likely signal Tuesday.
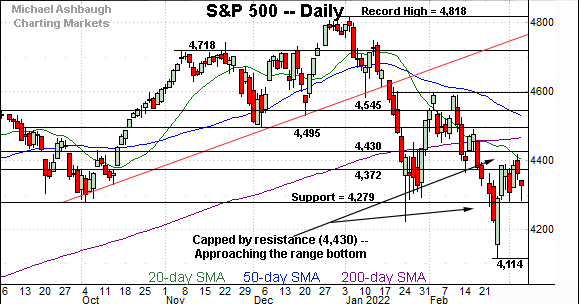
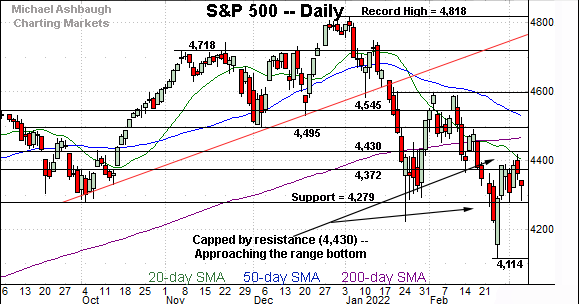
Meanwhile, the S&P 500 topped last week slightly under major resistance (4,430).
The prevailing downturn places major support (4,279) back in play.
More broadly, through last week’s close, the S&P 500 was the only major U.S. benchmark positioned atop the October low.
The bigger picture
As detailed above, the major U.S. benchmarks are not acting well technically.
On a headline basis, the Dow industrials and Nasdaq Composite both failed tests of key resistance — the Dow 34,000 and Nasdaq 13,850 areas. (See the daily charts.)
Meanwhile, the S&P 500 continues to press major support (4,279) an area it narrowly maintained last week. An extended retest remains underway early Monday.
Beyond technical levels, each benchmark’s intermediate- to longer-term bias remains firmly-bearish pending repairs.
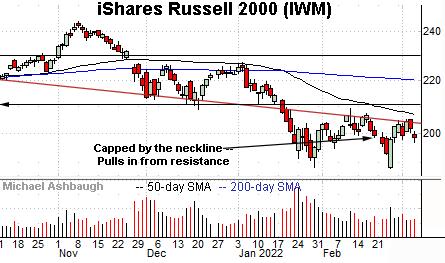
Moving to the small-caps, the iShares Russell 2000 ETF has topped near the neckline of its head-and-shoulders top, a pattern defined by the September, November and January peaks.
The prevailing pullback, once again, punctuates a failed test from underneath.
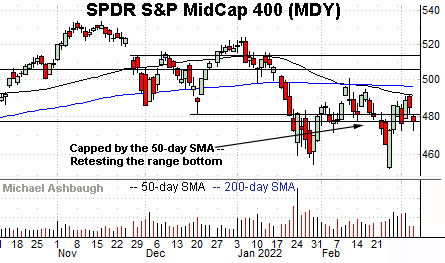
Meanwhile, the SPDR S&P MidCap 400 ETF remains comparably stronger.
Still, the MDY has stalled near its 50-day moving average, and pulled in to the range bottom.
Last week’s close (477.19) roughly matched major support (477.50), though the MDY has ventured lower to start this week.
Placing a finer point on the S&P 500, the index is challenging major support (4,279) an area also detailed on the daily chart.
Last week, Tuesday’s session low (4,279.5) and Friday’s session low (4,285) registered nearby.
On further weakness, deeper support holds in the 4,222-to-4,225 area, levels matching the January low (4,222) and the year-to-date closing low (4,225).
More broadly, the S&P 500 is tenuously positioned on the six-month view.
Tactically, the 4,279 area remains a bull-bear fulcrum. As detailed last week, a violation would likely wreck the S&P 500’s recovery attempt.
Beyond near-term issues, the S&P 500’s intermediate- to longer-term bias remains bearish pending extensive repairs. Eventual follow-through atop the 4,430 resistance, and the the 200-day moving average, currently 4,466, would be cause to reconsider the longer-term bias.
Watch list — Commodity prices spike amid geopolitical tensions
Drilling down futher, heightened geopolitical tensions have fueled massive commodity price spikes. The charts below exemplify the prevailing backdrop:
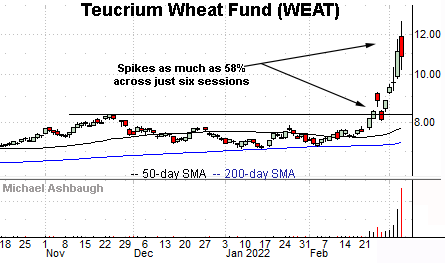
To start, the Teucrium Wheat Fund (WEAT) — a fund consisting of wheat futures contracts — has taken flight.
As illustrated, the fund has cleared its range top, spiking as much as 58% across just six sessions. The breakout has been fueled by a pronounced volume spike.
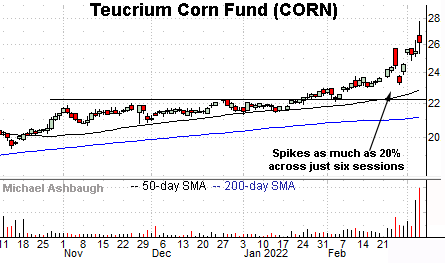
Similarly, the Teucrium Corn Fund (CORN) has taken flight, rising as much as 20% across just six sessions. This ETF tracks a weighted average of three corn futures contracts traded on the Chicago Board of Trade.
Here again, recent follow-through has been fueled by a volume spike.
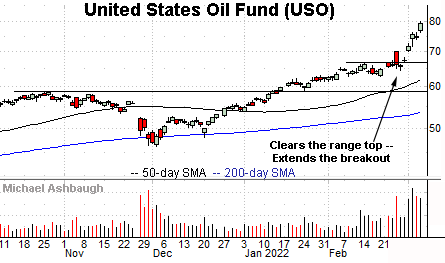
Moving to a more widely-tracked development, the United States Oil Fund (USO has also knifed sharply higher. The fund tracks the spot price of light, sweet crude oil.
Recall just after Thanksgiving (late November for those outside the U.S.), crude oil prices got torched amid omicron’s emergence.
Fast forward to the present, and prices have risen 73.3% from the December low. More immediately, crude oil prices have spiked as much as 21.6% over just the prior six sessions.
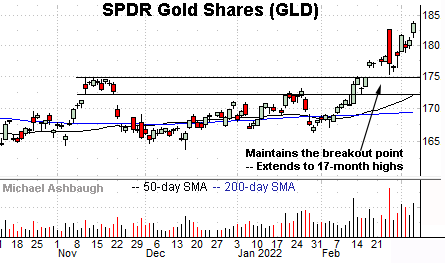
Looking elsewhere, the SPDR Gold Shares ETF (GLD) — most recently profiled Feb. 18 — continues to rise amid a safe-haven trade. Gold is also an inflation hedge, an added tailwind against the current backdrop.
Technically, the prevailing upturn punctuates a sucessful test of the breakout point (175.00) an area matching the November and mid-February peaks.
From current levels, the 182.60 and 181.60 areas mark near-term floors.
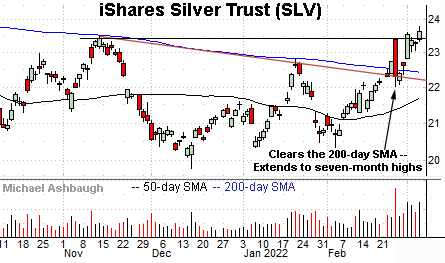
Meanwhile, the iShares Silver Trust (SLV) has also broken out, though less decisively.
Recent follow-through builds on a trendline breakout. Notice the trendline closely tracks the 200-day moving average.
Tactically, the breakout point (23.40) pivots to first support.
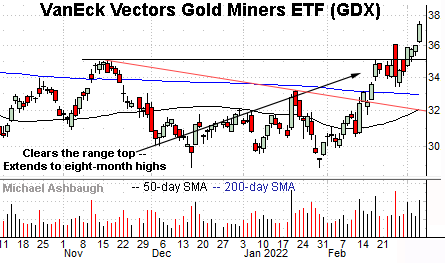
Concluding with one U.S. sector, the VanEck Vectors Gold Miners ETF (GDX) — profiled Feb. 18 — has tagged eight-month highs.
Here again, recent follow-through builds on a February trendline breakout. From current levels, near-term support (36.05) is followed by the firmer breakout point (35.10).


