Charting a lukewarm rally attempt, S&P 500 stalls at 200-day average
Focus: Major U.S. benchmarks vie to conclude January on an upswing
Technically speaking, the major U.S. benchmarks have asserted a holding pattern, of sorts, digesting a damaging downdraft to start the new year.
Against this backdrop, the S&P 500 is vying to rally from the January low — in the wake of a 9.8% downdraft, across about three weeks — though the index has thus far stalled almost precisely at its 200-day moving average, amid a failed test from underneath.
Editor’s Note: As always, updates can be directly accessed at https://chartingmarkets.substack.com. (Experimenting with a new layout on the Charting Markets main page.)
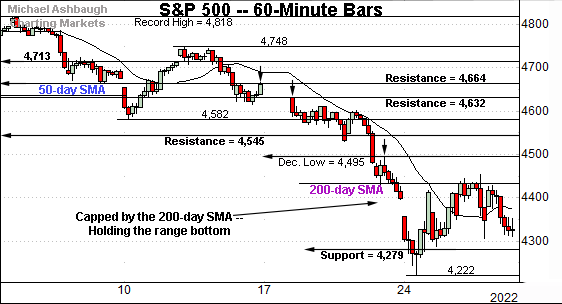
Before detailing the U.S. markets’ wider view, the S&P 500’s hourly chart highlights the past four weeks.
As illustrated, the S&P is holding its range bottom.
The prevailing rally attempt has registered as relatively flat, and capped by the 200-day moving average, currently 4,434.
On further strength, significant resistance matches the December low (4,495).
(Recall last Friday’s session high (4,494) matched resistance to punctuate a failed retest from underneath.)
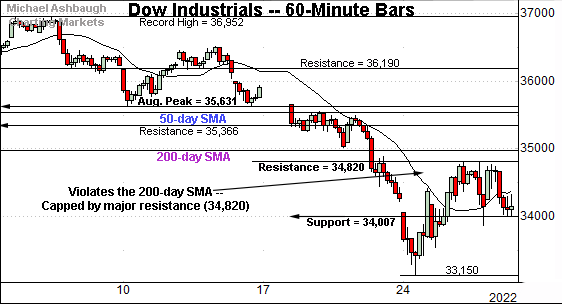
Similarly, the Dow Jones Industrial Average is digesting an aggressive January downdraft.
Tactically, its initial rally attempt has been capped by major resistance (34,820), detailed repeatedly.
The week-to-date high (34,815) has registered just under resistance.
Conversely, consider that Thursday’s session low (34,007) precisely matched support at the December low (34,007), detailed previously. (Also see the daily chart.)
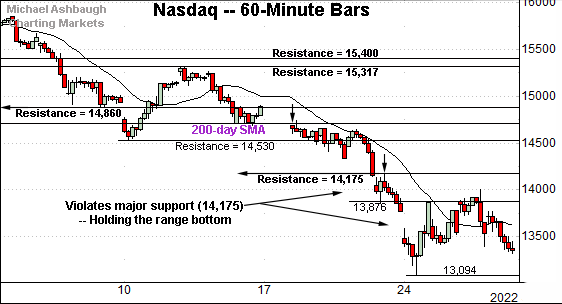
True to recent form, the Nasdaq Composite remains the weakest major benchmark.
As illustrated, the index has asserted a posture more firmly under its 200-day moving average.
Tactically, major resistance (14,175) — better illustrated below — remains a key bull-bear inflection point.
(Recall last Friday’s session high (14,171) closely matched resistance to punctuate a failed test from underneath.)
Widening the view to six months adds perspective.
On this wider view, the Nasdaq is digesting its technical breakdown.
Recall selling pressure accelerated amid last week’s violation of the 200-day moving average, currently 14,726.
More immediately, the initial rally attempt has been flat, and punctuated by downside follow-through to an eight-month closing low.
Tactically, an eventual rally atop the breakdown point (14,175) would mark a notable step toward stabilization. (Also see the post-breakdown peak (14,002) established this week.)
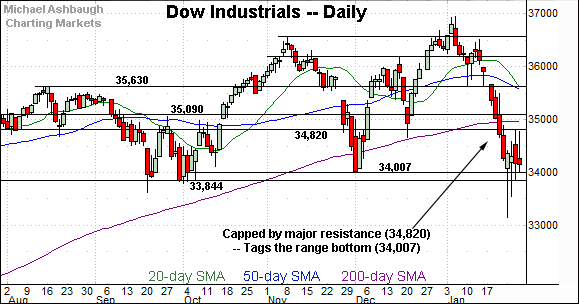
Looking elsewhere, the Dow Jones Industrial Average has also staged an aggressive January downdraft.
Moreover, its initial rally attempt has been capped by major resistance (34,820), an area detailed repeatedly.
To reiterate, the week-to-date high (34,815) has registered nearby.
Conversely, the Dow continues to challenge deeper support matching the December low (34,007). An eventual closing violation of the 34,000 area would punctuate a double top — defined by the November and January peaks — inflicting incremental damage to an already-bearish backdrop.
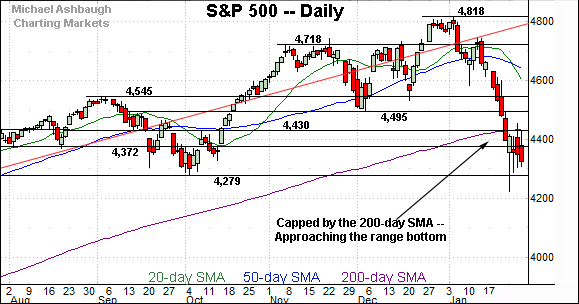
Similarly, the S&P 500 has staged a damaging January downdraft.
Recall selling pressure accelerated amid the violation of major support (4,545), an important bull-bear fulcrum, detailed repeatedly.
More immediately, the S&P has asserted a posture under its 200-day moving average, currently 4,434, a level matching the 4,430 resistance.
Thursday’s session high (4,428) registered nearby amid a failed retest from underneath.
The bigger picture
As detailed above, the major U.S. benchmarks have asserted a holding pattern, digesting a damaging January downdraft.
Against this backdrop, the bigger-picture technicals continue to support a bearish intermediate- to longer-term bias, pending repairs.
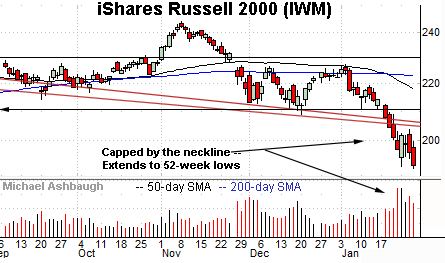
Moving to the small-caps, the iShares Russell 2000 ETF is digesting a downdraft to 52-week lows.
The recent strong-volume plunge punctuates a head-and-shoulders top defined by the September, November and January peaks.
Tactically, the post-breakdown peak (203.55) marks an overhead inflection point. An eventual close higher would mark an early step toward stabilization.
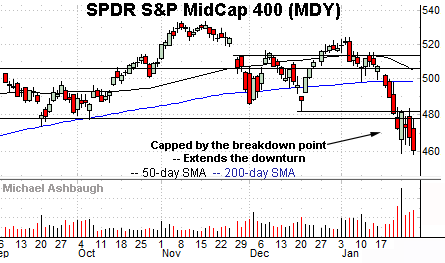
Similarly, the SPDR S&P MidCap 400 ETF is digesting its recent technical breakdown.
Tactically, the breakdown point (477.50) is followed by the December low (481.50). A reversal atop these areas would place the brakes on bearish momentum.
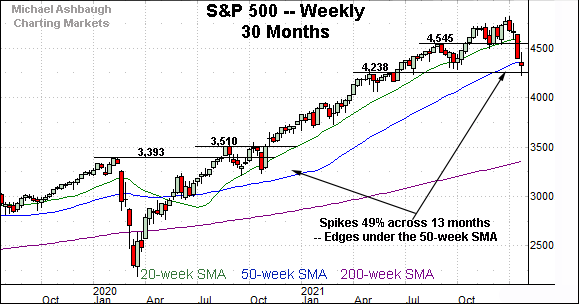
Returning to the S&P 500, this next chart is a weekly view, spanning 30 months. Each bar on the chart represents one week.
As illustrated, the S&P has pulled in aggressively from its record high (4,818), established Jan. 4, 2022.
From top to bottom, the downturn has spanned as much as 596 points, or 12.4%.
On a closing basis — the more widely-tracked metric — the downturn has spanned as much as 470 points, or 9.8%.
Put differently, the S&P 500 has nearly reached the 10% correction milestone, amid a swift downdraft, thus far spanning 17 sessions.
Against this backdrop, the S&P has ventured under its 50-week moving average, currently 4,358. The index has not registered a weekly close under the 50-week moving average since June 2020.
Delving deeper, recall that the January low (4,222) has registered in the vicinity of major support (4,238) detailed last week.
The quality of the rally attempt from this area — as measured by volume, directional strength, and the response to technical levels — should be a useful bull-bear gauge.
Speaking of the rally attempt’s quality, the S&P 500 has thus far registered a lackluster lift from the January low.
The upturn has stalled near the 200-day moving average, currently 4,434.
Returning to the S&P 500’s six-month view, the January downturn punctuates a modified double top — the M formation — defined by the November and January peaks.
Against this backdrop, the 4,430 resistance closely matches the 200-day moving average, currently 4,434.
Thursday’s session high (4,428) effectively matched resistance to punctuate a failed retest from underneath.
Tactically, the pending retest of the 4,430 area remains a useful bull-bear gauge. An eventual close higher would signal waning bearish momentum, opening the path to a potentially viable rally attempt.
On further strength, more distant resistance matches the breakdown point (4,495), a level partly defining the S&P 500’s double top.
As always, it’s not just what the markets do, it’s how they do it.
But generally speaking, the S&P 500’s backdrop continues to support a bearish intermediate- to longer-term bias pending a sustained reversal atop the breakdown point (4,495). Friday’s weekly close, and Monday’s monthly close, will also likely add color.


