Charting a corrective bounce, Nasdaq rises in wake of damaging downdraft
Focus: Europe and Japan stage technical breakdowns, Volatility Index recedes after nearly tagging 52-week highs
Technically speaking, the major U.S. benchmarks are trying to rally, rising in the wake of a damaging market downdraft.
Though the corrective bounce has surfaced amid an improved sentiment backdrop — detailed Monday — each benchmark’s more important intermediate- to longer-term bias remains bearish, pending repairs.
Editor’s Note: As always, updates can be directly accessed at https://chartingmarkets.substack.com. (Experimenting with a new layout on the Charting Markets main page.)
Before detailing the U.S. markets’ wider view, the S&P 500’s hourly chart highlights the past four weeks.
As illustrated, the S&P is digesting a downdraft to seven-month lows.
Tactically, the 200-day moving average, currently 4,433, is followed by resistance matching the December low (4,495).
Recall Friday’s session high (4,494) matched resistance to punctuate a failed retest from underneath.
Conversely, the S&P 500 has thus far maintained major support (4,279) an area better illustrated on the daily chart.
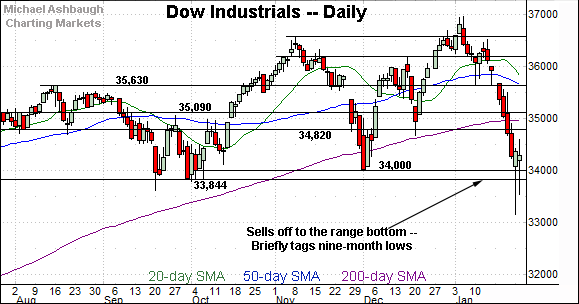
Meanwhile, the Dow Jones Industrial Average is digesting a downdraft to nine-month lows.
Tactically, familiar resistance (34,820) — detailed repeatedly — is followed by the 200-day moving average, currently 34,973.
Wednesday’s early session high (34,815) has registered just under major resistance.
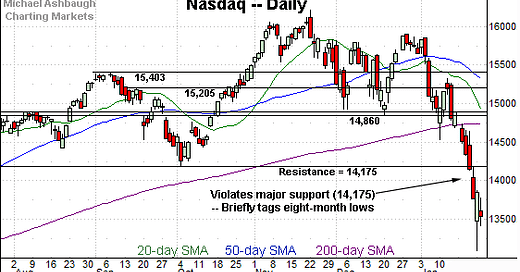
Against this backdrop, the Nasdaq Composite is digesting a downdraft to eight-month lows.
From current levels, the week-to-date peak (13,876) is followed by major resistance (14,175) better illustrated below.
Here again, Friday’s session high (14,171) effectively matched resistance to punctuate a failed test from underneath.
Widening the view to six months adds perspective.
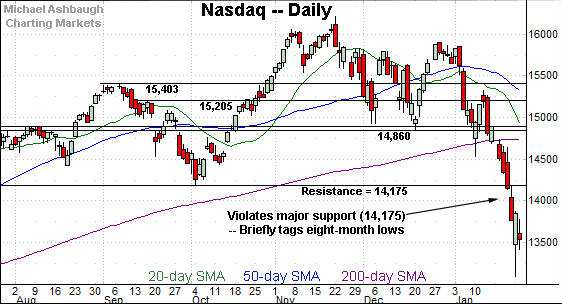
On this wider view, the Nasdaq has broken down technically.
Selling pressure accelerated amid last week’s violation of the 200-day moving average, currently 14,733.
Perhaps more notably, the index has followed through firmly under major support (14,175). The downdraft marks a material “lower low,” confirming the Nasdaq’s bearish primary trend shift.
Tactically, an eventual rally atop the breakdown point (14,175) would mark a notable step toward stabilization.
(Recall Friday’s session high (14,171) matched resistance amid a failed retest from underneath. Bearish price action.)
Looking elsewhere, the Dow Jones Industrial Average has pulled in aggressively from its record high, established Jan. 5.
The prevailing downturn places the index firmly under its 200-day moving average, currently 34,973.
Tactically, a retest of major resistance (34,820) — detailed repeatedly — is currently underway.
To reiterate, Wednesday’s early session high (34,815) has registered nearby.
Conversely, the Dow has thus far maintained deeper support matching the December low (34,007). An eventual closing violation of the 34,000 area would punctuate a double top — defined by the November and January peaks — incrementally damaging an already-bearish backdrop.
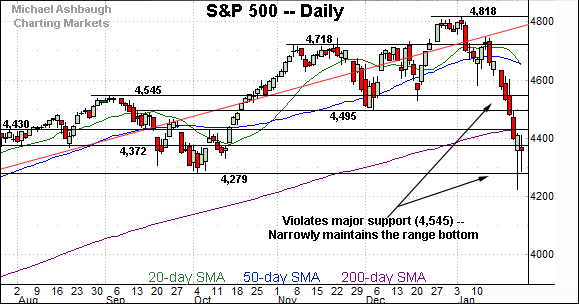
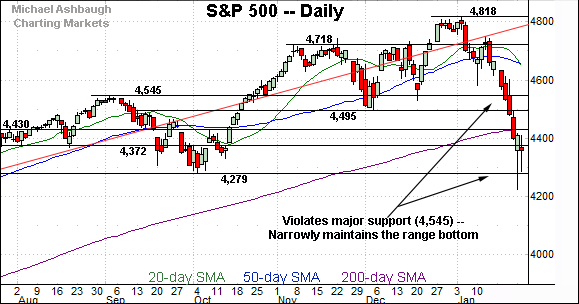
Meanwhile, the S&P 500 has placed distance under major support (4,545), an important bull-bear inflection point, detailed repeatedly.
The prevailing downturn has been punctuated by three straight closes under the 200-day moving average, currently 4,433.
Conversely, the S&P 500 has thus far maintained major support (4,279), a level defining its six-month range bottom.
The bigger picture
As detailed above, a nearly historic January downdraft — (by some measures) — has inflicted extensive damage to the U.S. markets.
On a headline basis, each big three benchmark has knifed through all kinds of support, notching at least three straight closes under its 200-day moving average.
As always, the 200-day moving average is a widely-tracked longer-term trending indicator.
Also recall that the Nasdaq Composite and S&P 500 have failed tests of major resistance from underneath — at Nasdaq 14,175 and S&P 4,495 — almost precisely.
Against this backdrop, each major benchmark has asserted a bearish intermediate- to longer-term bias. An eventual rally atop the Nasdaq 14,175 and S&P 4,495 areas would be cause to reassess.
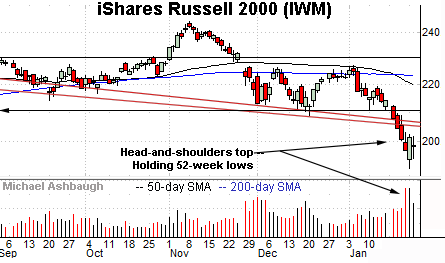
Moving to the small-caps, the iShares Russell 2000 ETF is digesting a downdraft to 52-week lows.
The prevailing downturn opens the path to a much less-charted patch — see the two-year chart above — and potentially material downside follow-through.
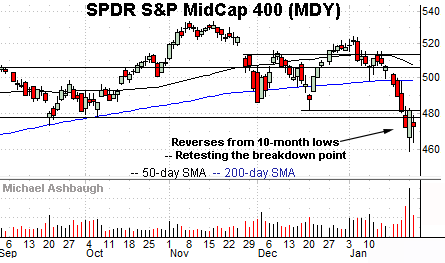
Similarly, the SPDR S&P MidCap 400 ETF has broken down technically, reaching 10-month lows.
Tactically, the breakdown point (477.50) pivots to resistance, and is followed by the December low (481.50). A rally atop these areas would would mark a step toward stabilization.
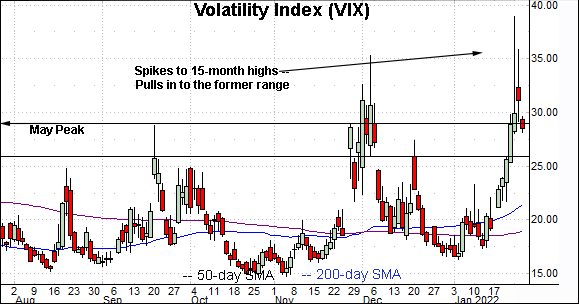
Moving to market sentiment, the Volatility Index (VIX) — a widely-tracked market-fear gauge — finally spiked to start this week.
As always, extreme VIX highs signal excessive fear, consistent with durable S&P 500 lows.
Conversely, extreme VIX lows signal investor complacency, consistent with S&P 500 tops.
Against the current backdrop, the Volatility Index has briefly tagged 15-month highs.
Separately, Tuesday’s close (31.16) marked a nearly 52-week peak — the highest since Jan. 29, 2021 — though by a narrow margin, eclipsing the December closing peak by just four hundredths of a point.
So collectively, the prevailing sentiment backdrop has indeed supported at least a corrective bounce, as detailed Monday.
Still, market bears might contend the prevailing volatility spike — though undoubtedly respectable — is not yet commensurate with the technical damage inflicted to the S&P 500. Time will tell. (The S&P 500’s prevailing backdrop is nothing like its backdrop at the December lows.)
Returning to the S&P 500, this next chart is a weekly view, spanning 30 months. Each bar on the chart represents one week.
As illustrated, the S&P has reversed from its record high (4,818), established not long ago, on Jan. 4, 2022.
Against this backdrop, the January low (4,222) — established Monday — has registered in the vicinity of major support (4,238) detailed last week. The quality of the rally from this area is worth tracking. (As measured by volume, directional strength, and response to technical levels.)
More immediately, the S&P has effectively nailed its 50-week moving average, currently 4,358.
Tuesday’s close (4,356) registered nearby, amid a retest that remains underway. The S&P has not registered a weekly close under the 50-week moving average since June 2020. Friday’s weekly close may add color.
Returning to the S&P 500’s six-month view, the January downturn punctuates a modified double top — the M formation — defined by the November and January peaks.
The bearish pattern is partly defined by the December low (4,495).
To reiterate, Friday’s session high (4,494.5) matched the breakdown point (4,495) to punctuate a failed retest from underneath.
More immediately, initial resistance from current levels matches the 200-day moving average, currently 4,433, and the 4,430 mark.
As always, it’s not just what the markets do, it’s how they do it.
But generally speaking, the S&P 500’s backdrop supports a bearish intermediate- to longer-term bias pending a reversal atop the breakdown point (4,495). The response to the Federal Reserve’s policy statement will likely add color.
Beyond the U.S. — Market downdraft inflicts global damage
Drilling down further, the January market downdraft has not been contained to the U.S. Two influential regions stand out:
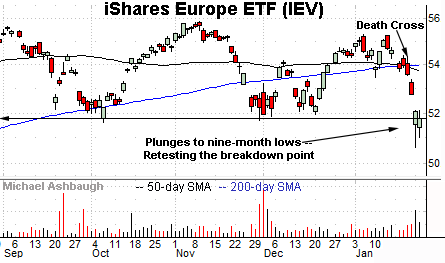
To start, the iShares Europe ETF has plunged to nine-month lows. The prevailing downturn punctuates a head-and-shoulders top defined by the September, November and January peaks.
Separately, selling pressure has accelerated amid a death cross, or bearish 50-day/200-day moving average crossover.
Tactically, Tuesday’s close (51.78) almost precisely matched the breakdown point (51.76).
On further strength, the response to gap resistance — around 52.10 and 52.75 — will likely add color. Follow-through atop these areas would mark technical progress.
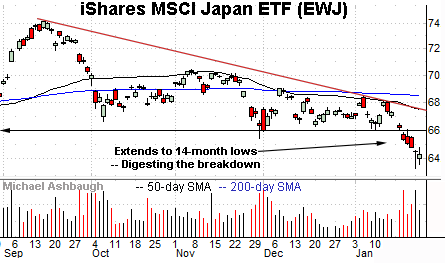
Finally, the iShares MSCI Japan ETF has tagged 14-month lows. The prevailing strong-volume downturn punctuates a descending triangle hinged to the September peak.
Tactically, the breakdown point (66.00) pivots to resistance.
More distant trendline resistance tracks the 50-day moving average. An eventual reversal atop these areas would place the brakes on bearish momentum.

