Charting a December holding pattern, U.S. benchmarks maintain the range
Focus: Gold challenges 200-day average; Health care, energy sector and financials digest technical breakouts, GLD, XLV, XLE, XLF
Technically speaking, the major U.S. benchmarks have pulled in, pressured amid a sluggish December start.
But tactically, the downturn has inflicted limited damage, thus far, with each index maintaining its prevailing one-month range.
Editor’s Note: As always, updates can be directly accessed at https://chartingmarkets.substack.com.
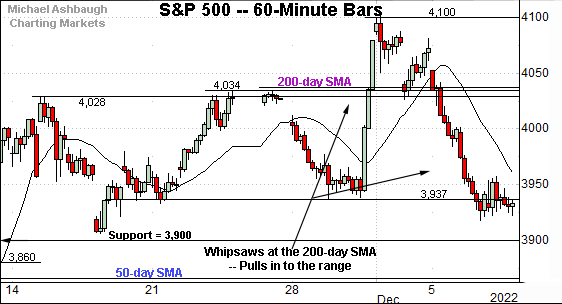
Before detailing the U.S. markets’ wider view, the S&P 500’s hourly chart highlights the past four weeks.
As illustrated, the S&P has asserted a relatively well-defined one-month range.
From current levels, the 3,937 area is followed by major support matching the 3,900 mark.
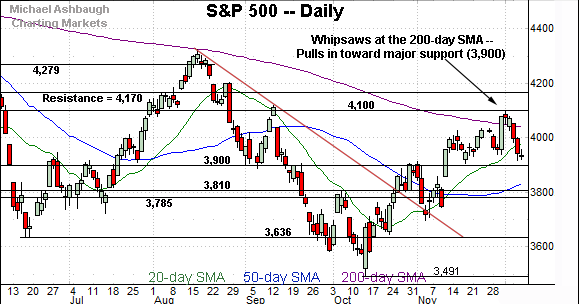
Slightly more broadly, the December pullback punctuates a turn-of-the-month whipsaw at the 200-day moving average, currently 4,039.
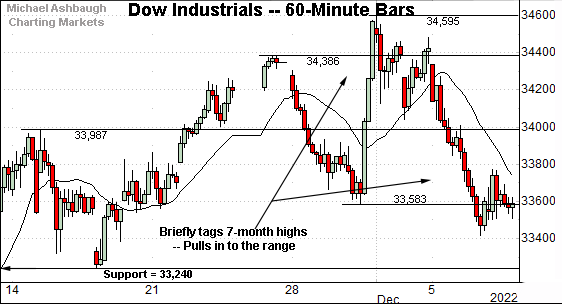
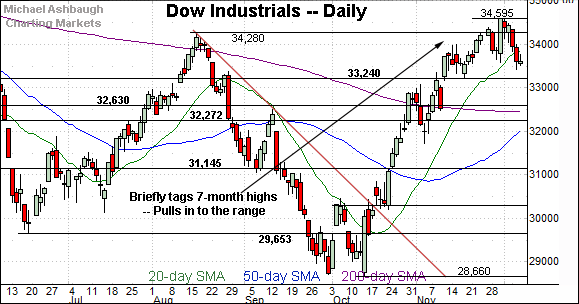
Meanwhile, the Dow Jones Industrial Average remains incrementally stronger.
Nonetheless, the index has extended a pullback from seven-month highs.
Tactically, a familiar near-term floor (33,583) is followed by major support (33,240), the latter also detailed on the daily chart.
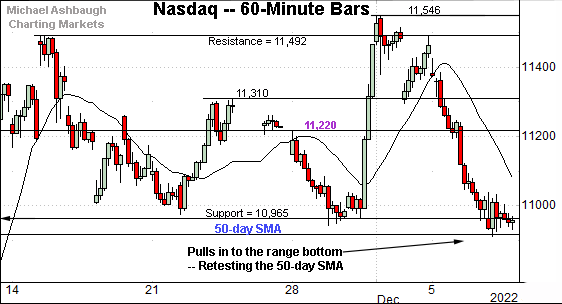
Against this backdrop, the Nasdaq Composite continues to lag behind.
Consider that the December pullback places the 50-day moving average, currently 10,916, back in play.
The week-to-date low (10,910) has registered nearby.
More broadly, recall the late-November straightline spike, fueled by well received Federal Reserve policy langauge. Each index has pulled in to the lower bound of the initial spike.
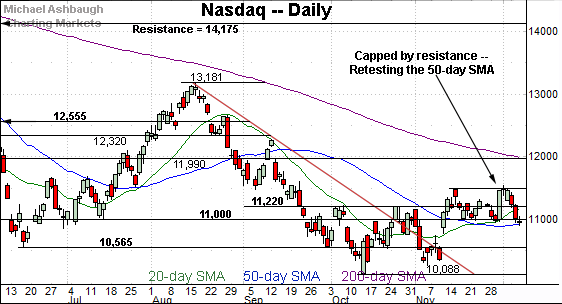
Widening the view to six months adds perspective.
On this wider view, the Nasdaq is traversing a well-defined one-month range.
Against this backdrop, the November peak (11,492) defines the range top. The Dec. 2 session high (11,492) and and the December closing high (11,482) matched resistance amid failed retests from underneath.
Conversely, the 50-day moving average, currently 10,916, effectively defines the range bottom. (Also see the hourly chart.)
Tactically, a violation of the 10,910 area would mark a material “lower low” raising a caution flag.
Looking elsewhere, the Dow Jones Industrial Average has diverged sharply from the other benchmarks.
Tactically, the 20-day moving average, currently 33,892, remains an inflection point. The blue-chip benchmark has registered consecutive closes lower for the first time since October.
Delving deeper, major support (33,240) is followed by the marquee 200-day moving average. Based on today’s backdrop, a violation of the 33,240 area would raise a technical question mark.
Meanwhile, the S&P 500 has extended a pullback from major resistance.
The specific area matches the 200-day moving average and trendline resistance illustrated on the S&P 500’s weekly chart, detailed in the next section.
The bigger picture
As detailed above, the major U.S. benchmarks have pulled in amid a sluggish December start.
Still, the downturn has thus far inflicted limited damage in the broad sweep.
Tactically, each benchmark remains range-bound, pulling in to the lower bound of its late-November Fed-induced spike. (See the hourly charts.)
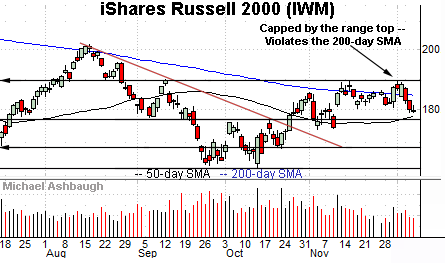
Moving to the small-caps, the iShares Russell 2000 ETF (IWM) also remains range-bound.
Within the range, the small-cap benchmark has balked at resistance (189.90), placing distance under its 200-day moving average, currently 184.65.
On further weakness, the 50-day moving average, currently 178.06, is closely followed by deeper support, circa 177.30.
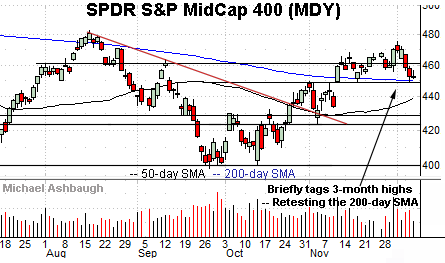
Meanwhile, the SPDR S&P MidCap 400 ETF (MDY) continues to outpace the Russell 2000.
Nonetheless, the mid-cap benchmark has pulled in to its 200-day moving average, currently 450.00, a level closely matching the breakout point (448.40). Eventual follow-through under this area would raise a technical question mark.
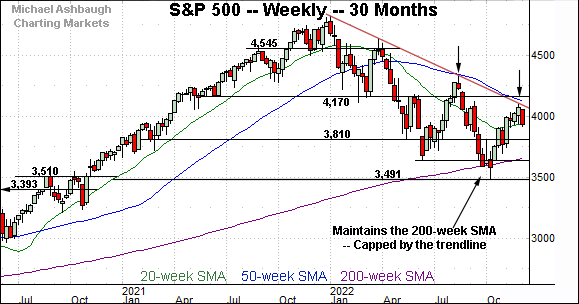
Returning to the S&P 500, this next chart is a weekly view spanning 30 months. Each bar on the chart represents one week.
As illustrated, the S&P 500 has extended a pullback from trendline resistance, a level roughly tracking the 50-week moving average, currently 4,119.
Recall the trendline is hinged to the S&P’s all-time high, established Jan. 4, 2022. Each test of the trendline has been punctuated by a subsequent “lower low” confirming the primary downtrend. (See the Dec. 6 review, for added detail regarding the weekly chart.)
Returning to six-month view, the S&P 500 has extended a pullback from the December peak.
To reiterate, the downturn punctuates a jagged test of the 200-day moving average, as well as a failed trendline test on the weekly chart.
Moreover, the re-violation of the 200-day moving average registered amid Monday’s aggressive 13-to-1 down day, detailed previously. (Declining volume surpassed advancing volume by a 13-to-1 margin.)
So collectively, the week-to-date price action raises a question mark.
Still, downside follow-through has thus far been limited, and the S&P 500 has maintained its prevailing one-month range.
Tactically, the 3,900 mark remains a bull-bear inflection point. The S&P 500’s recovery attempt gets the benefit of the doubt barring a violation.
Watch List
Drilling down further, the SPDR Gold Shares ETF (GLD) has come to life technically.
The shares initially spiked four weeks ago, knifing atop trendline resistance amid a volume spike. The breakout punctuated a double bottom defined by the September and October lows.
By comparison, the subsequent pullback has been flat — underpinned by the breakout point (161.10) — and punctuated by upside follow-through. Bullish price action.
More immediately, the shares are challenging the 200-day moving average, currently 167.36. Follow-through atop the 200-day would raise the flag to a potential primary trend shift.
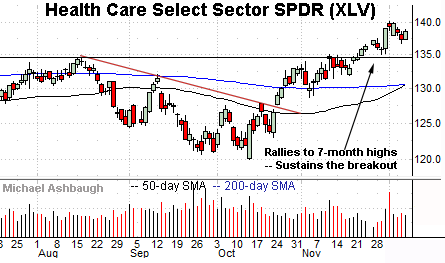
Moving to U.S. sectors, the Health Care Select Sector SPDR (XLV) is acting well technically. (Yield = 1.5%.)
Late last month, the shares knifed to seven-month highs, clearing resistance matching the August peak.
The subsequent December flag pattern — the relatively tight range — positions the group to extend its uptrend. Tactically, a sustained posture atop the breakout point (134.50) signals a bullish bias.
More broadly, notice the group’s golden cross — or bullish 50-day/200-day moving average crossover — an event that has signaled Thursday. The crossover signals that the intermediate-term uptrend has overtaken the longer-term trend.
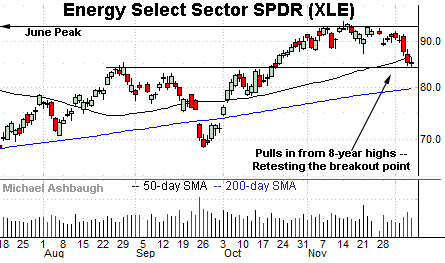
Looking elsewhere, the Energy Select Sector SPDR (XLE) remains technically well positioned. (Yield = 3.4%.)
As illustrated, the prevailing pullback from eight-year highs places the group near the breakout point (84.10) and 11.3% under the November peak.
Delving deeper, the 200-day moving average, currently 79.78, marks an inflection point. A sustained posture higher signals a bullish bias. (Notice the September island reversal, defined by gaps at the 200-day.)
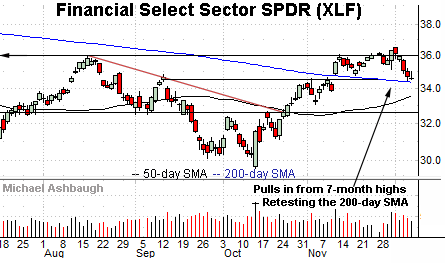
Finally, the Financial Select Sector SPDR’s (XLF) is digesting a November breakout, of sorts. (Yield = 2.0%.)
Tactically, gap support (34.80) is closely followed by the 200-day moving average, currently 34.34, areas detailed previously. (See the Nov. 17 review.)
Delving slightly deeper, the ascending 50-day moving average, currently 33.60, has marked an inflection point. (See the October trendline breakout.) The group’s rally attempt is intact barring a violation of these areas.


