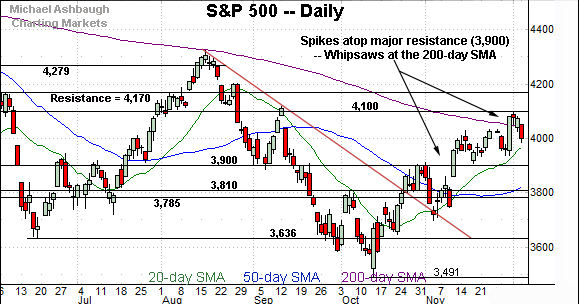
Charting a bearish reversal, S&P 500 violates 200-day average
Focus: Turn-of-the-month market whipsaw punctuated by aggressive 13-to-1 down day
Technically speaking, the major U.S. benchmarks have pulled in to start December, reversing course amid respectable selling pressure.
Against this backdrop, the S&P 500 has violated its 200-day moving average — amid nearly 13-to-1 negative breadth — while the Nasdaq Composite has balked at major resistance (11,490).
Editor’s Note: As always, updates can be directly accessed at https://chartingmarkets.substack.com.
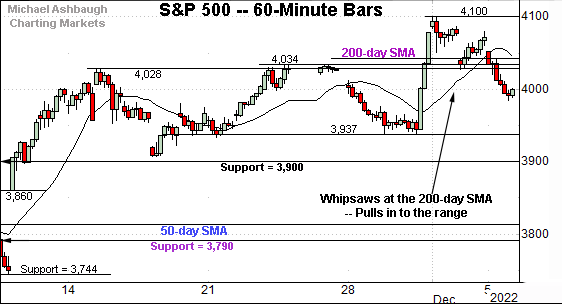
Before detailing the U.S. markets’ wider view, the S&P 500’s hourly chart highlights the past four weeks.
As illustrated, the S&P has pulled in to its former range.
The prevailing downturn punctuates a turn-of-the-month whipsaw at the 200-day moving average, currently 4,042.
Tactically, near-term support (3,937) is followed by a firmer floor matching the 3,900 mark.
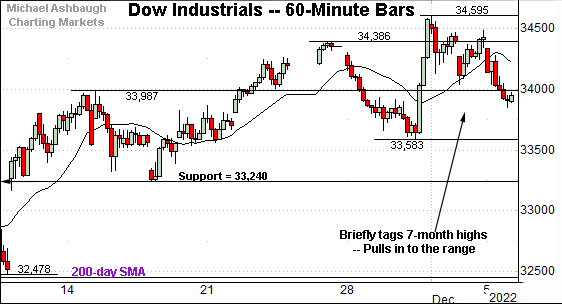
Meanwhile, the Dow Jones Industrial Average remains the strongest major benchmark.
But here again, the index has pulled in amid a recent market whipsaw. (Recall well received (and possibly misinterpreted) Federal Reserve policy language fueled the steep late-November spike.)
From current levels, a near-term floor (33,583) is followed by major support (33,240), an area also detailed on the daily chart.
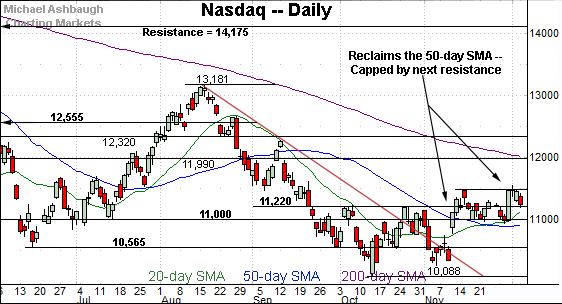
Against this backdrop, the Nasdaq Composite continues to lag behind the other benchmarks.
As illustrated, the index remains range-bound, despite briefly tagging two-month highs to start December.
Tactically, the nearly one-month range has been underpinned by the 50-day moving average, currently 10,914.
Widening the view to six months adds perspective.
On this wider view, the Nasdaq has balked at the November peak (11,492).
Friday’s session high (11,492) and last week’s closing high (11,482) matched resistance to punctuate failed retests from underneath.
As detailed last week, follow-through atop the 11,490 area would mark a “higher high” confirming the intermediate-term uptrend. So the hesitation near resistance raises a question mark.
Nonetheless, the Nasdaq’s recovery attempt gets the benefit of the doubt barring a violation of the 10,915-to-11,000 area.
Looking elsewhere, the Dow Jones Industrial Average remains much stronger than the other benchmarks.
As illustrated, the index has briefly tagged seven-month highs before pulling in to its former range.
Tactically, the 20-day moving average, currently 33,810, is followed by major support (33,240). (Recall the mid-November low (33,239) matched support.)
The Dow has not closed under its 20-day moving average since mid-October.
Meanwhile, the S&P 500 has whipsawed at its marquee 200-day moving average, currently 4,042.
As always, the 200-day is a widely-tracked longer-term trending indicator. The relatively swift reversal lower raises a question mark.
The bigger picture
Collectively, the major U.S. benchmarks have pulled in to start December, reversing course amid respectable selling pressure.
Against this backdrop, the Nasdaq Composite has balked at major resistance (11,490) while the S&P 500 has re-violated its 200-day moving average.
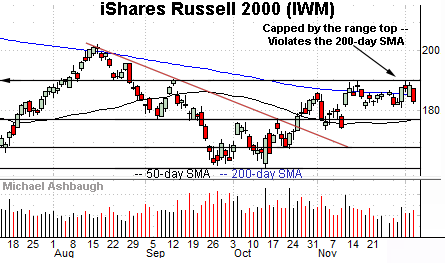
Moving to the small-caps, the iShares Russell 2000 ETF (IWM) remains range-bound.
Within the range, the small-cap benchmark has balked at resistance (189.90) and continues to hug the 200-day moving average, currently 184.80.
Tactically, the prevailing range bottom (180.50) is followed by the 50-day moving average, currently 177.56.
Meanwhile, the SPDR S&P MidCap 400 ETF (MDY) continues to outpace the Russell 2000.
As illustrated, the mid-cap benchmark briefly tagged three-month highs to start December, and has sustained a break atop the 200-day moving average, currently 450.16.
Market breadth surges amid cross currents
Beyond the charts, market breadth has surged — in both directions — at the turn of the month.
To start, recall November concluded with last Wednesday’s unusually strong 9-to-1 up day. NYSE advancing volume surpassed declining volume by a nearly 9-to-1 margin.
But fast forward just three sessions, and Monday’s nearly 13-to-1 down day has likely neutralized the bullish setup.
To be sure, the S&P 500 can trend higher from current levels, though the formerly bullish internal backdrop is no longer a tailwind.
As always, in a textbook world, two 9-to-1 up days — across about a seven-session window — reliably signals a material trend shift. But the signal is effectively eliminated with a comparable intervening down day, which has just registered. (See Thursday’s review for added detail regarding the internals.)
Returning to the S&P 500, this next chart is a weekly view spanning 30 months. Each bar on the chart represents one week.
As illustrated, the S&P 500 has stalled at trendline resistance.
The trendline is hinged to the S&P’s all-time high, established Jan. 4, 2022. Each retest of the trendline has been punctuated by a subsequent “lower low” confirming the primary downtrend.
Slightly more broadly, the late-year upturn originates from a jagged test of the 200-week moving average, currently 3,652. (Also recall the October low (3,491) roughly matched the Nov. 2020 U.S. election-fueled breakout point (3,510) illustrated above.)
Beyond technical levels, the S&P 500 has rallied as much as 17.4% from the October low across just eight weeks.
By comparison, the prior rally — from the June low to the August peak — spanned 18.9% across about 10 weeks.
Returning to six-month view, the S&P 500 has reversed from the December peak.
The downturn punctuates a jagged test of the 200-day moving average, as well as a failed trendline test on the weekly chart, detailed previously.
As reference, the August peak marked a failed test of the 200-day moving average, and a failed trendline test on the weekly chart.
So the S&P 500 has failed a potentially consequential test, pressured amid Monday’s aggressive 13-to-1 negative breadth.
Tactically, the November breakout point (3,900) marks major support. The S&P 500’s recovery attempt gets the benefit of the doubt barring a violation.
As always, it’s not just what the markets do, it’s how they do it. No new setups today.


