Charting a technical breakdown, Nasdaq violates major support (14,175)
Focus: Volatility Index tags 14-month high, S&P 500 stalls at the breakdown point (4,495), Small- and mid-cap benchmarks violate key levels
Technically speaking, broadly-based selling pressure continues to accelerate, inflicting extensive damage to the major U.S. benchmarks.
Against this backdrop, the S&P 500 and Nasdaq Composite have tagged multi-month lows, placing distance firmly under the marquee 200-day moving average.
Though a corrective bounce is due against the prevailing sentiment backdrop, each big three U.S. benchmark has asserted a firmly-bearish intermediate-term bias.
Editor’s Note: As always, updates can be directly accessed at https://chartingmarkets.substack.com. (Experimenting with a new layout on the Charting Markets main page.)
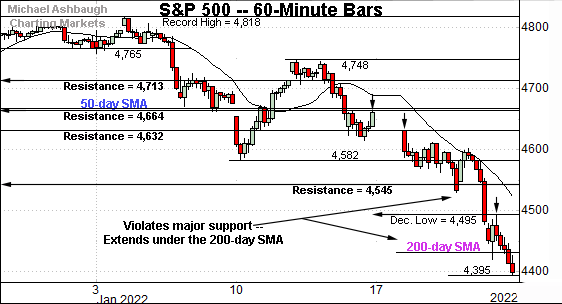
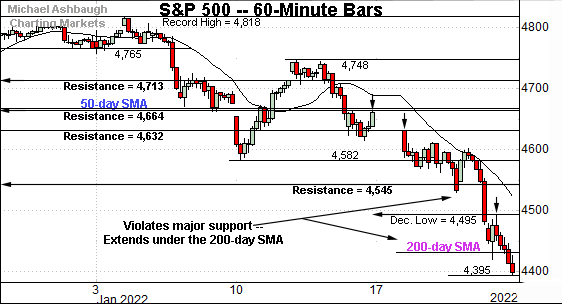
Before detailing the U.S. markets’ wider view, the S&P 500’s hourly chart highlights the past four weeks.
As illustrated, the S&P has extended a violation of major support (4,545) an area also detailed on the daily chart.
In the process, the index has ventured firmly under its 200-day moving average, currently 4,430. Last week’s close marked the S&P’s first close under the 200-day moving average since June 2020.
Separately, Friday’s session high (4,494) matched resistance at the December low (4,495) to punctuate a failed retest from underneath. (Also see the daily chart.)
This marks the third recent failed test of well-defined resistance. (Recall the prior week’s close (4,663) matched major resistance (4,664) — detailed previously — and last week’s high (4,632) also matched familiar resistance (4,632).)
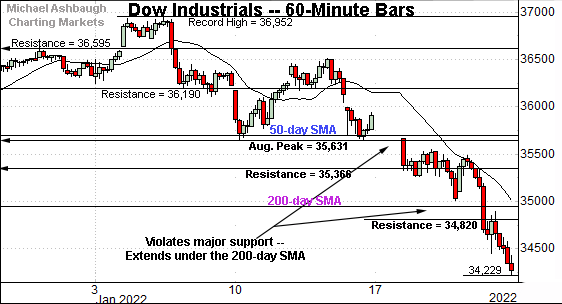
Similarly, the Dow Jones Industrial Average has placed distance under its 200-day moving average.
The prevailing downturn punctuates a violation of major support (35,631), an area also illustrated on the daily chart.
The Dow had twice previously maintained support (35,631) just before last week’s breakdown.
Against this backdrop, the Nasdaq Composite remains the weakest major benchmark.
As illustrated, the index continues to place distance under its the 200-day moving average.
Moreover, the Nasdaq has violated major support (14,175) — better illustrated below — and failed the initial retest from underneath. Bearish price action.
(Friday’s session high (14,171) effectively matched resistance.)
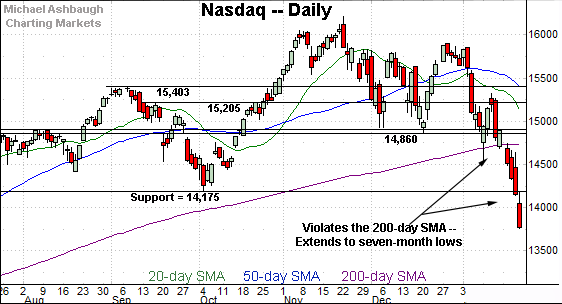
Widening the view to six months adds perspective.
On this wider view, the Nasdaq has broken down technically.
To start, the index has knifed firmly under its 200-day moving average, currently 14,732, notching four straight closes lower. (See the four straight closes near session lows.)
Moreover, the Nasdaq violated major support (14,175) tagging seven-month lows.
The downturn punctuates a material “lower low” confirming the Nasdaq’s bearish primary trend shift.
Also recall Friday’s session high (14,171) punctuated a failed test of the breakdown point from underneath. An eventual rally atop this area would mark an early step toward stabilization.
Beyond specific levels, the Nasdaq’s sentiment backdrop — as measured by the CBOE Nasdaq 100 Volatility Index (VXN) — has finally reached bearish extremes. The prevailing backdrop likely lays the groundwork for at least a corrective bounce in the sessions ahead. (Note that “corrective bounce” means a relatively fleeting market lift, not a durable market rally.)
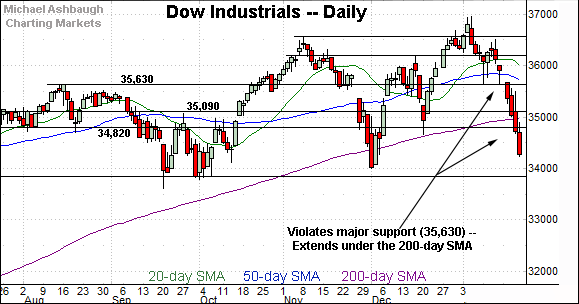
Looking elsewhere, the Dow Jones Industrial Average has violated major support (35,630), an area detailed repeatedly.
The downturn has been punctuated by persistent follow-through, placing the index firmly under its 200-day moving average, currently 34,962.
Delving deeper, the December low (34,007) marks an inflection point.
A closing violation would punctuate a double top — the M formation — defined by the November and January peaks.
On further weakness, deeper support (33,844) matches the Dow’s seven-month range bottom. A closing violation would mark a seven-month closing low. The Dow has ventured firmly under this area early Monday.
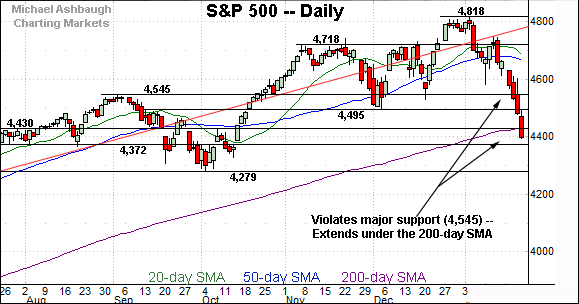
Similarly, the S&P 500 has knifed firmly under major support (4,545), an area detailed repeatedly.
The prevailing downturn has been punctuated by a lone close under the 200-day moving average, currently 4,430. (A consecutive close under the 200-day looks virtually assured early Monday.)
The bigger picture
As detailed above, the prevailing market downdraft continues to accelerate, inflicting broadly-based technical damage.
Each benchmark’s intermediate-term bias remains bearish, based on today’s backdrop.
But perhaps more notably, the Nasdaq Composite has signaled a primary trend shift, asserting a bearish longer-term bias.
(On a granular note, the Nasdaq Composite and S&P 500 have both failed tests of major resistance from underneath — Nasdaq 14,175 and S&P 4,495 — raising technical red flags. Market bears are dictating the technical tone.)
Moving to the small-caps, the iShares Russell 2000 ETF has extended a downdraft to 52-week lows.
To reiterate, the prevailing downturn opens the path to an air pocket, and potentially material downside follow-through. (See the five-year chart.)
Also recall the head-and-shoulders top defined by the September, November and January peaks. The prevailing downturn originates from the 50-day moving average, and resistance matching the November gap.
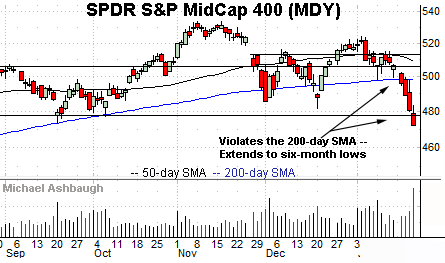
Similarly, the SPDR S&P MidCap 400 ETF has broken down technically.
The prevailing downturn has been fueled by a volume spike, placing the benchmark at six-month lows.
Tactically, a reversal atop the breakdown point — the 477.50 area — would mark a step toward stabilization.
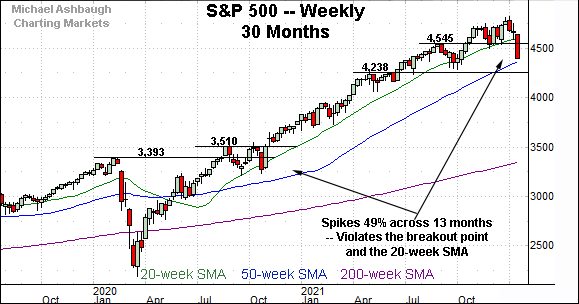
Returning to the S&P 500, this next chart is a weekly view, spanning 30 months. Each bar on the chart represents one week.
As detailed previously, the S&P 500 is digesting a massive 13-month, 49% rally from the November 2020 low — (just before the U.S. election) — to the Jan. 4, 2022 peak.
Across this span, last week’s close (4,398) marked the S&P’s first violation of major support — of any kind — as well as the first close materially under the 20-week moving average, currently 4,563. (The final September 2021 weekly close registered narrowly lower, by about four points.)
An overdue consolidation phase is currently underway.
Placing a finer point on the S&P 500, the index has violated all kinds of technical levels amid persistent selling pressure.
Moreover, the index has failed notable retests of key levels from underneath.
Recall the prior week’s close (4,663) matched major resistance (4,664), and last week’s high (4,632) also matched familiar resistance (4,632).
Separately, Friday’s session high (4,494.5) matched the December peak (4,495) to punctuate a failed retest. Bearish price action.
Returning to the six-month view, the prevailing downturn punctuates a modified double top — the M formation — defined by the November and January peaks.
The bearish pattern is partly defined by the December low (4,495), also last week’s breakdown point.
To reiterate, Friday’s session high (4,494.5) matched the breakdown point (4,495) to punctuate a failed retest from underneath. Bearish price action.
Delving deeper, significant support matches the October low (4,279) a level defining the S&P’s six-month range bottom. The response to this area, potentially across the next several sessions, should be a useful bull-bear gauge.
On a slightly positive note, the CBOE Volatility Index (VIX) has surged early Monday, tagging its highest level since October 2020.
So the prevailing sentiment backdrop signals an oversold near-term condition, due at least a corrective bounce.
Beyond near-term bounces, the prevailing downturn has inflicted extensive technical damage, and pending market rallies would be expected to draw selling pressure into strength. (See the recent failed tests at Nasdaq 14,175 and S&P 4,494.)
The response to the Federal Reserve’s mid-week policy directive will also likely add color.
Watch List — Traditional sector leaders violate key levels
Drilling down further, the recent downside market acceleration has inflicted damage to the traditional sector leaders — the technology sector, transports and financials.
To start, the Invesco QQQ Trust tracks the Nasdaq 100 Index, and as always, serves as a large-cap technology sector proxy.
As illustrated, the QQQ has violated its 200-day moving average, currently 365.60, pressured amid a volume spike.
The downturn places its six-month range bottom (350.30) under siege. Eventual downside follow-through would mark a material “lower low” confirming the bearish primary trend shift signaled last week.
Conversely, a swift reversal back atop the 200-day moving average would mark a step toward stabilization.
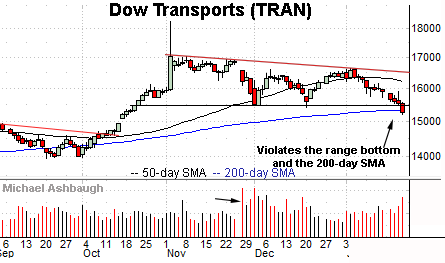
Meanwhile, the Dow Transports have tagged three-month lows.
In the process, the group has ventured under its 200-day moving average, currently 15,330. The prevailing downturn punctuates a descending triangle hinged to the steep early-November spike.
Tactically, a sustained reversal atop the breakdown point, circa 15,470, would place the brakes on bearish momentum.
More broadly, the transports have been pressured amid a sustained volume increase — and sluggish price action — since omicron’s emergence, the day after Thanksgiving.
Finally, the Financial Select Sector SPDR has violated its breakout point.
The prevailing strong-volume downturn places its 200-day moving average, currently 38.04, under siege.
The financials have not closed under the 200-day moving average, since early-November 2020, just before the U.S. election.
Delving slightly deeper, the prevailing range bottom (37.54) marks important support. Eventual downside follow-through would punctuate a modified double top — defined by the October and January peaks — raising a technical red flag.
Summing up the sector backdrop
Combined, the January downdraft has inflicted sub-sector damage.
Each group has violated major suport, pressured amid persistent selling pressure. Sustained rally attempts have been virtually non-existent.
More immediately, potentially consequential technical tests remain underway. Perhaps most notably, the transports and financials have ventured under their respective 200-day moving averages, a widely-tracked primary trending indicator.
Tactically, material follow-through under the 200-day moving average — (see the QQQ’s backdrop) — would raise a technical red flag. The response to each area — potentially across the next several sessions — should be a useful bull-bear gauge.


