Charting a bullish-leaning tilt, S&P 500 extends rally attempt even as Treasury yields spike
Focus: U.S. stocks rally as 10-year yield takes flight, Insurance sector's stealth breakout attempt, TNX, KIE, MA, TECK, CME
Technically speaking, the major U.S. benchmarks have extended a February rally attempt, rising to reclaim key inflection points.
Notably, the upside follow-through has registered concurrently with surging U.S. Treasury yields — a development strengthening the bull case — though the bigger-picture backdrop remains less than straightforward.
Editor’s Note: As always, updates can be directly accessed at https://chartingmarkets.substack.com. (Experimenting with a new layout on the Charting Markets main page.)
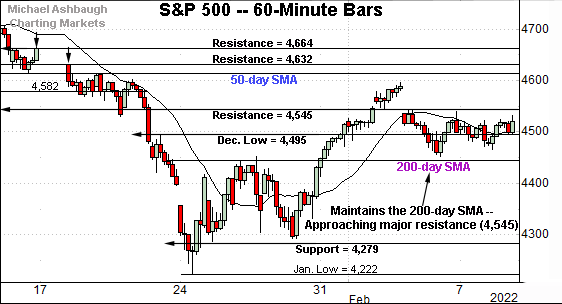
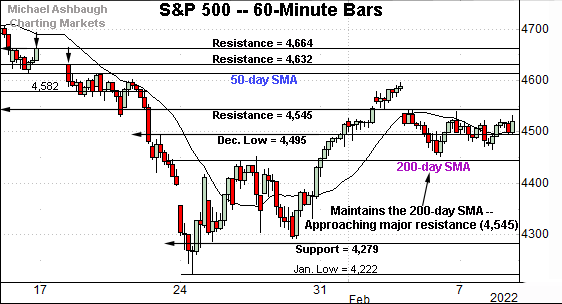
Before detailing the U.S. markets’ wider view, the S&P 500’s hourly chart highlights the past four weeks.
As illustrated, the S&P seems to have stabilized in the wake of a pronounced January whipsaw.
The prevailing pullback has been flattish, and underpinned by the 200-day moving average, currently 4,449.
More immediately, the S&P is vying to reclaim major resistance (4,545). Wednesday’s early session low (4,547) has registered nearby.
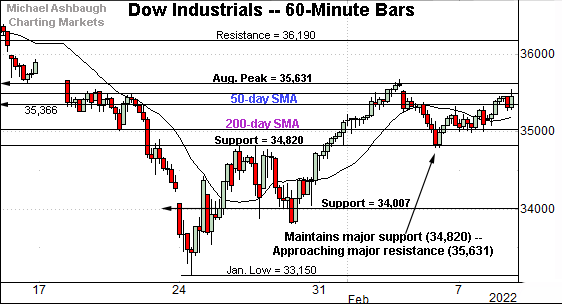
Similarly, the Dow Jones Industrial Average has registered less volatile February price action.
Here again, its recent pullback has been flat, and underpinned by major support (34,820).
The prevailing upturn places major resistance matching the August peak (35,631) under siege. (Also see the daily chart.)
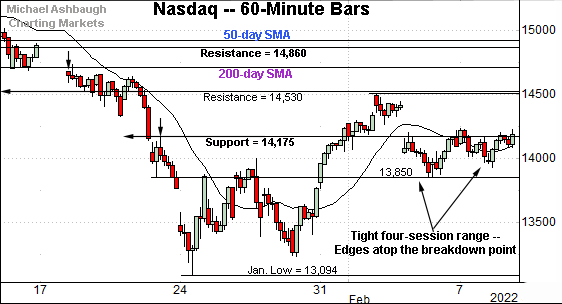
Against this backdrop, the Nasdaq Composite remains the weakest major benchmark.
Nonetheless, the index has also asserted an orderly four-week range.
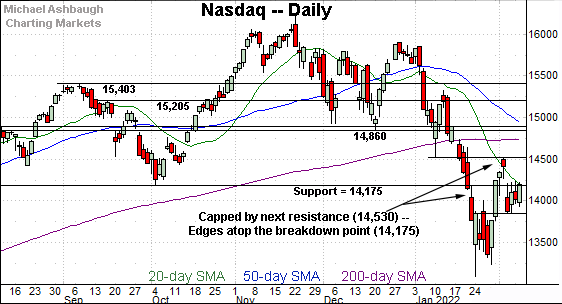
Tactically, Tuesday’s close (14,194) registered slightly atop the breakdown point (14,175), and the index has extended firmly higher early Wednesday.
On further strength, additional overhead spans from 14,504 to 14,530, an area also illustrated below.
Widening the view to six months adds perspective.
On this wider view, the Nasdaq has whipsawed in the wake of a massive January plunge.
Notably, the breakdown point (14,175) has marked a very recent bull-bear inflection point. (Also see the four-session range on the hourly chart.)
On further strength, more distant overhead broadly spans from 14,504 to 14,530, levels matching the February peak and early-January low. Follow-through atop this area would mark a “higher high” signaling technical progress.
The pending retest from underneath will likely add color.
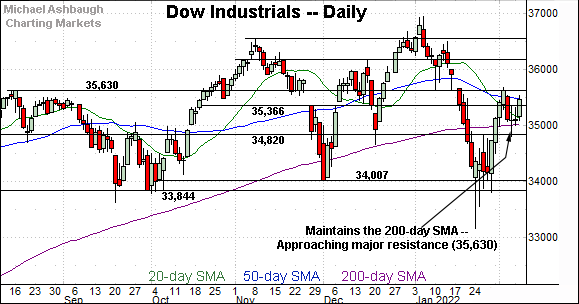
Looking elsewhere, the Dow Jones Industrial Average has stabilized in the wake of a volatile 2022 start — at least for the near-term.
Tactically, the index has sustained a bullish reversal atop the 200-day moving average, currently 35,029. Seven straight closes have registered atop the 200-day.
More immediately, the Dow is vying to reclaim major resistance (35,630).
Last week’s closing high (35,629) matched resistance (35,630), and the index has ventured atop the inflection point early Wednesday.
(On a granular note, the February pullback has also been underpinned by major support (34,820), a level matching the prior week’s high (34,815).)
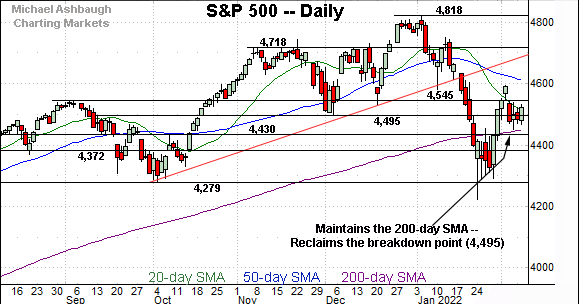
Similarly, the S&P 500 is vying to stabilize after a volatile 2022 start.
Here again, the index has thus far sustained a bullish reversal atop the 200-day moving average, currently 4,449.
This area roughly matches the 4,430 inflection point, detailed previously.
The bigger picture
As detailed above, the major U.S. benchmarks have stabilized in recent sessions, largely treading water amid decreased volatility. (See the tight four-session ranges on the hourly chart.)
Against this backdrop, the S&P 500 and Dow industrials have maintained a posture atop the marquee 200-moving average.
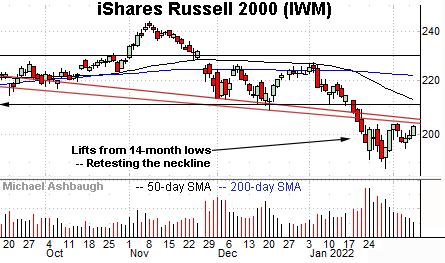
Moving to the small-caps, the iShares Russell 2000 ETF continues to lag behind the major U.S. benchmarks.
Still, the small-cap benchmark has reversed from 14-month lows, and is pressing the neckline of its head-and-shoulders top.
Slightly more distant overhead matches the breakdown point, an area broadly spanning from 208.75 to 211.10. Follow-through atop this area would mark a step toward stabilization.
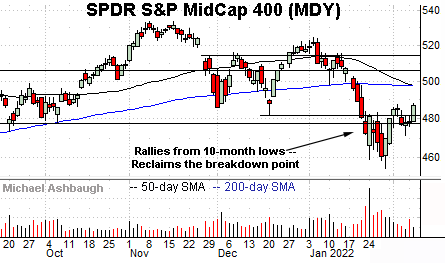
Meanwhile, the SPDR S&P MidCap 400 ETF remains comparably stronger, rising to reclaim its breakdown point (477.50).
The prevailing upturn, perhaps paradoxically, dovetails with a death cross — or bearish 50-day/200-day moving average crossover — an event that has signaled Wednesday.
Tactically, the prevailing recovery attempt is intact barring a violation of the range bottom (477.50).
The MDY’s more important intermediate- to longer-term bias remains bearish pending more extensive repairs. Follow-through atop the 50- and 200-day moving averages — the 497.50 area — would strengthen the bull case.
Placing a finer point on the S&P 500, the index has asserted an orderly four-session range.
Recall the February pullback has been underpinned by the 200-day moving average, currently 4,449, a bull-bear inflection point, detailed previously.
Tactically, more distant overhead (4,582) — illustrated above, and also detailed previously — is followed by the February peak (4,495). Wednesday’s early session high (4,582) has matched the former.
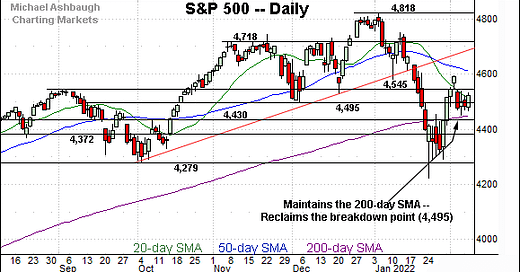
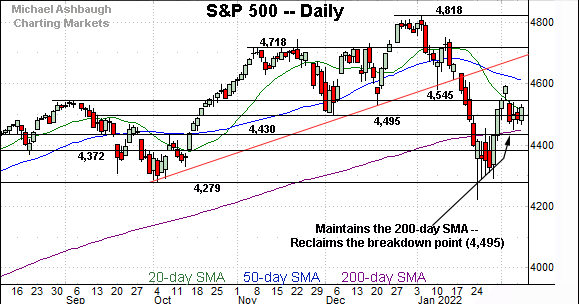
Returning to the S&P 500’s daily chart, the prevailing backdrop remains less than completely straightforward.
The current technical tension falls out as follows:
To start, the aggressive January downdraft registered nearly historic milestones in spots — selling pressure not experienced since the 1980’s and 1990’s. This downdraft signals a bearish intermediate-term bias that remains in play.
Conversely, the bullish reversal from the January low has been punctuated by a sustained posture atop the 200-day moving average, a widely-tracked longer-term trending indicator.
The S&P 500’s successsful test of its six-month range bottom (4,279) — to avert a major “lower low” — and the subsequent reversal atop the 200-day moving average preserve a bullish longer-term bias.
So combined, an unusually aggressive intermediate-term downtrend is currently clashing with the more important longer-term uptrend.
Against this backdrop, the S&P 500’s recovery attempt is intact, and its longer-term bias remains bullish barring a violation of the 4,430-to-4,450 area.
Beyond technical levels, the U.S. stock benchmarks have rallied this week — even as the 10-year Treasury yield takes flight — a bullish development for U.S. stocks. (See the next section for added detail.)
Watch List
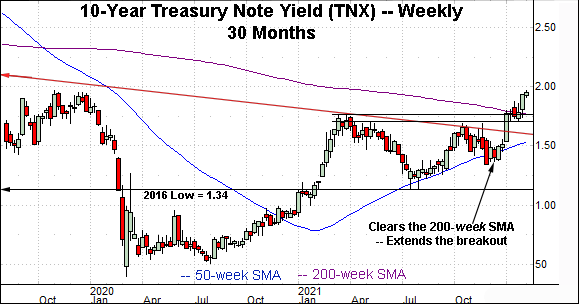
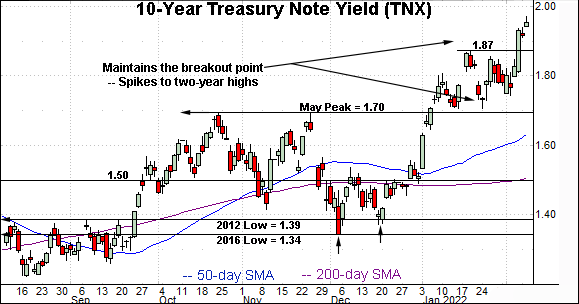
Drilling down further, the 10-year Treasury note yield continues to take flight.
In the process, the yield has tagged a 27-month peak, its highest levels since November 2019.
Notably, the prevailing upturn places the yield firmly atop its 200-week moving average, currently 1.77, for the first time since May 2019. The upturn dovetails with a massive trendline breakout. (See the 30-month chart.)
Also recall the prevailing early-2022 surge resembles the strong 2021 start, a move that would ultimately span 75 basis points across about 10 weeks. (The current 2022 upturn has spanned 46 basis points across just under six weeks.)
More broadly, the prevailing upturn originates from a headline inflection point matching the 2016 low (1.34). Recall this is the point from which the plunge to pandemic-zone territory originated. (See the Sept. 8 review, as the yield’s breakout was taking shape.)
Fundamentally, the chart above strengthens the bull case for U.S. stocks. The S&P 500 has rallied amid the yield’s latest leg higher, a move unlike the January price action.
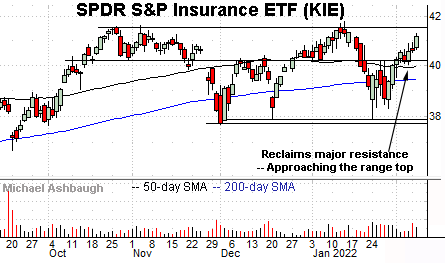
Moving to U.S. sectors, the SPDR S&P Insurance ETF is acting well technically. (Yield = 1.8%.)
Late last month, the group staged a stealth breakout, reclaiming the 50- and 200-day moving averages, as well as a well-defined pivot point (40.15).
The prevailing upturn places record highs within striking distance. Tactically, a sustained posture atop the 50-day moving average, currently 40.00, signals a bullish bias.
More broadly, the group is well positioned on the five-year chart, rising from a prolonged nine-month bullish continuation pattern.
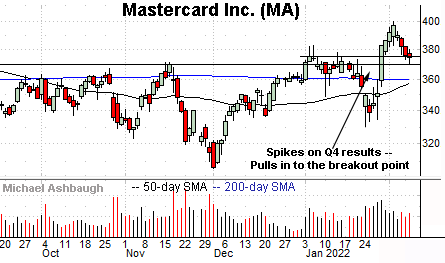
Mastercard, Inc. is a well positioned large-cap name.
Late last month, the shares knifed to nine-month highs, rising after the company’s strong quarterly results. The breakout punctuates a head-and-shoulders bottom defined by the October, December and January lows. (The 200-day moving average very loosely defined the neckline.)
By comparison, the subsequent pullback has been orderly, placing the shares near the breakout point (375.40) and 6.8% under the February peak.
Also notice the pending golden cross, or bullish 50-day/200-day moving average crosover.
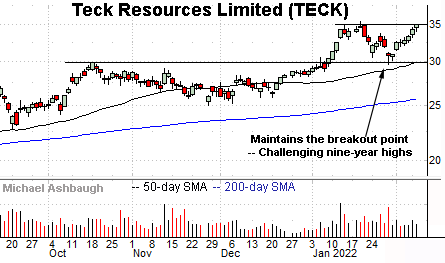
Teck Resources Limited its a large-cap Vancouver-based miner and producer of copper, zinc, steelmaking coal and related minerals.
Technically, the shares have rallied to the range top, rising to challenge nine-year highs.
The prevailing upturn punctuates a successful test of the breakout point (29.90) at the late-January low. An intermediate-term target projects to the 40 area on follow-through.
Finally, CME Group, Inc. — formerly known as Chicago Mercantile Exchange Holdings, Inc. — is acting well technically.
The shares are likely getting away Wednesday, rising after the company’s strong fourth-quarter results, released pre-market.
The prevailing upturn builds on an aggressive early-month breakout, placing the shares in record territory. Tactically, a sustained posture atop the breakout point, circa 232.00, signals a comfortably bullish bias.
(Note the prevailing upturn punctuates a prolonged three-month base. The longer the base, the higher the space.)

