Charting a bull-bear stalemate, S&P 500 hesitates at the breakdown point
Focus: Semiconductor sector digests technical breakdown; Alphabet, Amazon and Meta Platforms (formerly Facebook) diverge amid massive earnings-fueled price action.
Technically speaking, the major U.S. benchmarks have reversed respectably from the January low, though the rally attempt gets mixed marks (at best) for style.
Amid the volatility, the S&P 500 has reasserted a posture back atop its 200-day moving average — which is constructive — though the index has also struggled to reclaim key overhead inflection points.
Editor’s Note: As always, updates can be directly accessed at https://chartingmarkets.substack.com. (Experimenting with a new layout on the Charting Markets main page.)
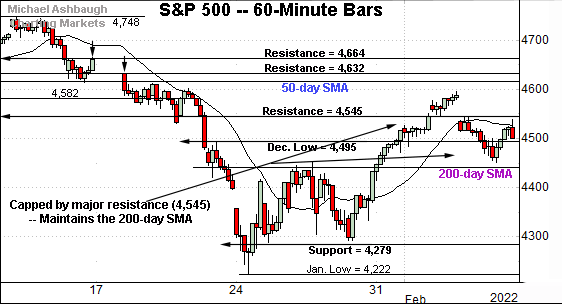
Before detailing the U.S. markets’ wider view, the S&P 500’s hourly chart highlights the past four weeks.
As illustrated, the S&P is compressing between two familiar levels.
To start, the index remains capped by major resistance (4,545).
Conversely, the index has thus far sustained its break back atop the 200-day moving average, currently 4,446.
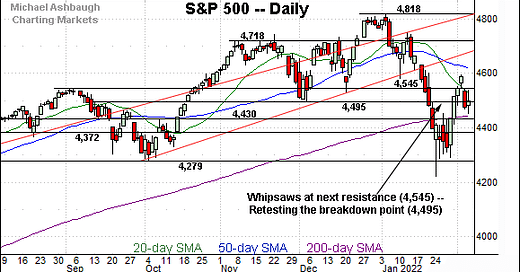
Within this very near-term range, the S&P 500 continues to retest its breakdown point (4,495). Each area is also illustrated on the daily chart.
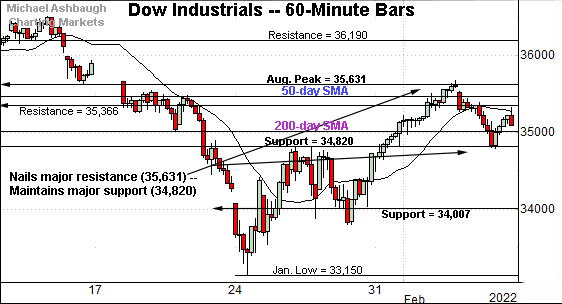
Similarly, the Dow Jones Industrial Average is crammed between two technical areas.
Recall major resistance matches the August peak (35,631).
Wednedsday’s close (35,629) effectively matched resistance, and the index has pulled in.
Conversely, the Dow has thus far maintained major support (34,820).
Here again, both areas are also illustrated on the daily chart.
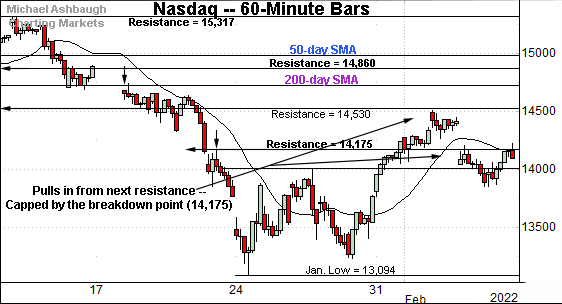
True to recent form, the Nasdaq Composite remains the weakest major benchmark.
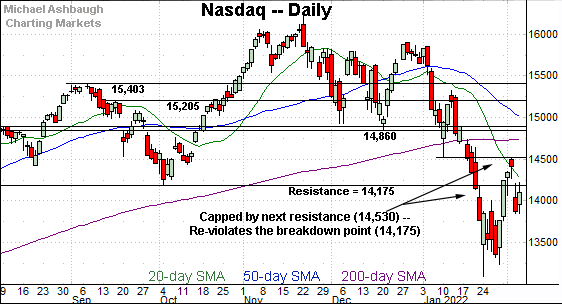
Tactically, the index topped last week slightly under resistance matching the early-January low (14,530).
More immediately, the Nasdaq has asserted a posture back under more significant resistance matching its breakdown point (14,175). Both areas are also illustrated below.
Widening the view to six months adds perspective.
On this wider view, the Nasdaq is off to a jagged February start, asserting a posture back under its breakdown point (14,175).
(Recall the breakdown point matches the February 2021 peak (14,175), the July low (14,178) and the October low (14,181).)
Slightly more broadly, the prevailing downturn punctuates a failed test of the early-January low (14,530).
More distant overhead matches the marquee 200-day moving average, currently 14,735.
Beyond specific levels, the Nasdaq has asserted a bearish bigger-picture bias pending repairs. Eventual follow-through atop the 14,500 area would mark a “higher high” signaling technical progress.
Looking elsewhere, the Dow Jones Industrial Average has pulled in from major resistance.
To reiterate, last week’s closing high (35,629) matched resistance (35,630), and selling pressure has surfaced.
Tactically, the 200-day moving average, currently 35,013, is relatively closely followed by major support (34,820).
An eventual violation of the 34,820 area opens the path to a less-charted patch, and potential retest of the 34,000 mark.
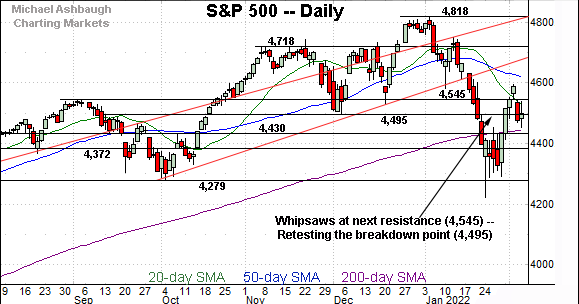
Similarly, the S&P 500 has whipsawed amid a volatile 2022 start.
Tactically, the index has reversed back under major resistance (4,545) an area detailed last week.
Separately, the S&P continues to test its breakdown point (4,495). Last week’s close (4,500) registered nearby amid a retest that remains underway.
The bigger picture
Collectively, the major U.S. benchmarks have reversed respectably from the January low, though the rally attempt gets mixed marks (at best) for style.
Tactically, the S&P 500 and Dow industrials hourly charts exemplify the prevailing technical tension.
Though each benchmark has thus far maintained its 200-day moving average — which is constructive — the recent rally attempts have also stalled near major resistance. See the pullbacks from S&P 4,545 and Dow 35,630.
Moving to the small-caps, the iShares Russell 2000 ETF continues to digest its recent technical breakdown.
Recall last month’s strong-volume downdraft punctuated a head-and-shoulders top, defined by the September, November and January peaks.
The subsequent upturn stalled near the pattern’s neckline, and the small-cap benchmark has subsequently pulled in. Bearish price action. (Also see the five-year chart.)
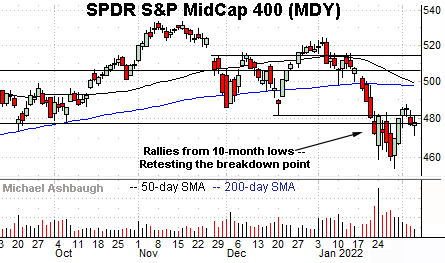
Meanwhile, the SPDR S&P MidCap 400 ETF continues to retest its breakdown point (477.50).
More broadly, recall the pending death cross — or bearish 50-day/200-day moving average crossover — an event that will likely signal Tuesday. (The Russell 2000’s January downdraft accelerated amid a death cross.)
Tactically, sustained follow-throgh atop the breakdown point (477.50) and the December low (481.48) would mark technical progress.
Returning to the S&P 500’s daily chart, the index is traversing a lower plateau.
Tactically, the 4,545 resistance remains an overhead inflection point, an area the index closely observed last week.
More immediately, the breakdown point (4,495) remains in play, a level hinged to the S&P 500’s double top, defined by the November and January peaks.
Last week’s close (4,500) registered nearby amid a retest that remains underway.
Delving deeper, the S&P 500’s 200-day moving average, currently 4,445, is closely followed by the 4,430 support.
As always, it’s not just what the markets do, it’s how they do it.
But generally speaking, the S&P 500’s longer-term bullish bias is intact barring a violation of the 4,430 area.
Watch List
Drilling down further, the VanEck Vectors Semiconductor ETF is digesting a January technical breakdown.
The group initially plunged three weeks ago, punctuating a double top, defined by the November and January peaks.
By comparison, the subsequent rally attempt has been comparably flat, fueled by deecreased volume. Bearish price action.
Tactically, upside follow-through atop the breakdown point (287.70) would place the group on firmer technical ground.
Conversely, the group is vying to stabilize, notching five straight closes atop the 200-day moving average, currently 270.30. A fragile recovery attempt is intact barring a violation of this area.
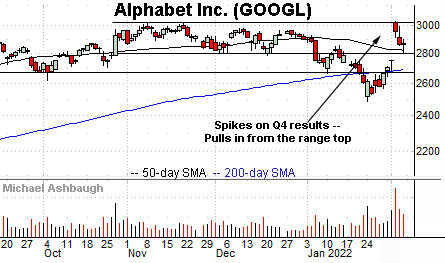
Moving to specific names, Alphabet, Inc. is acting well technically.
Earlier this month, the shares gapped sharply higher, briefly tagging record highs after the company’s strong quarterly results.
The subsequent pullback has been fueled by decreased volume, placing the shares 5.8% under the February peak.
Tactically, the 50-day moving average, currently 2,822.70, is followed by the former range bottom (2,800). The prevailing rally attempt is intact barring a violation.
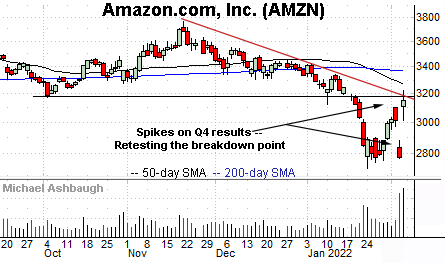
Meanwhile, Amazon.com has reached a headline technical test.
The shares gapped sharply higher to conclude last week, rising after the company’s strong fourth-quarter results. (The upturn punctuated a small single-day bullish island reversal.)
In the process, the shares are challenging the breakdown point — the 3,176-to-3,190 area — levels closely matching trendline resistance.
Tactically, sustained follow-through atop the 3,190 area would mark a notable step toward stabilization. Conversely, a failed retest from underneath would preserve Amazon’s currently bearish backdrop. The next several sessions will likley add color.
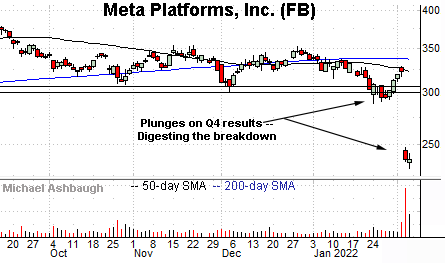
Finally, Meta Platforms, Inc. — the company formerly known as Facebook — has broken down technically.
In fact, the shares just registered the biggest single-day plunge in market history, losing $232 billion in market value — (nearly one-quarter trillion dollars!) — after the company’s not-so-well-received quarterly results.
The strong-volume downdraft places the shares at 18-month lows.
Tactically, this is a name to avoid pending extensive repairs. An eventual close atop gap resistance (248.00) would mark an early step toward stabilization.
Summing up the backdrop
Collectively, last week’s massive single-day moves (in both directions) — from several of the world’s largest companies — exemplify an unstable bigger-picture backdrop.
Though anything’s possible, a durable market rally would not conventionally emerge as the world’s largest companies add or lose hundreds of billions in dollar value across just one day.

