Charting a bullish 2022 start, S&P 500 asserts holding pattern near record highs
Focus: 10-year yield nails the range top, Financials and Energy sector stage trendline breakouts, TNX, XLF, XLE, JNPR, HES, FANG
U.S. stocks are mixed mid-day Wednesday, vacillating as a familiar sector rotation — in this case, back toward the re-opening trade — remains in play.
Against this backdrop, the S&P 500 has asserted a bull flag, digesting its latest break to record territory. Constructive price action.
Editor’s Note: As always, updates can be directly accessed at chartingmarkets.substack.com.
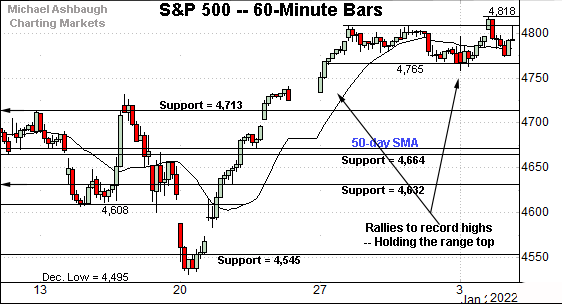
Before detailing the U.S. markets’ wider view, the S&P 500’s hourly chart highlights the past four weeks.
As illustrated, the S&P has sustained its latest break to record territory.
Tactically, the prevailing range bottom (4,765) is followed by firmer support in the 4,713-to-4,718 area.
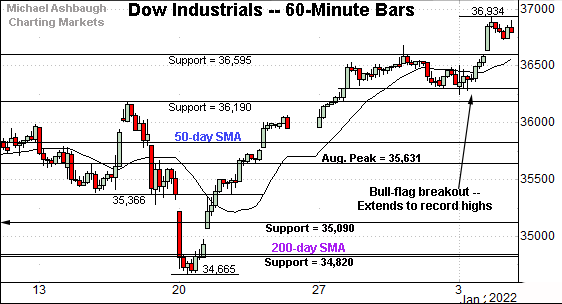
Meanwhile, the Dow Jones Industrial Average has started 2022 with a modest break to record highs.
The prevailing upturn punctuates a bull flag, the previously tight one-week range.
Tactically, notable support spans from about 36,565 to 36,595, the former matching the November peak.
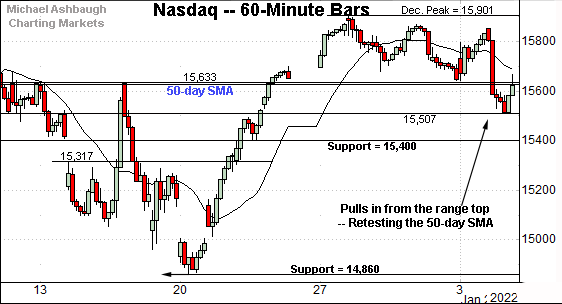
True to recent form, the Nasdaq Composite is lagging behind the other major benchmarks.
In fact, the index is retesting its 50-day moving average, currently 15,618.
Tactically, gap support (15,507) — detailed previously — is followed by a firmer floor around the 15,400 mark.
(Tuesday’s session low (15,512) roughly matched gap support amid a respectable single-day downturn.)
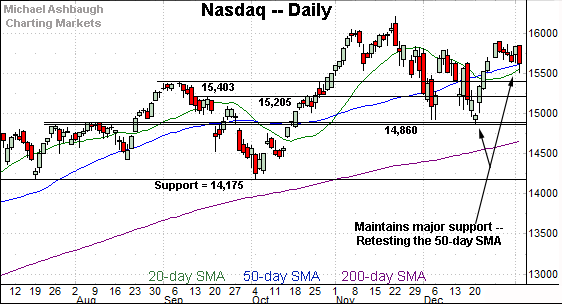
Widening the view to six months adds perspective.
On this wider view, the Nasdaq is vying to sustain a break atop its 50-day moving average.
Delving deeper, the former breakout point (15,400) remains its first significant floor.
More broadly, the prevailing upturn originates from major support (14,860) closely matching the July peak (14,863). An eventual violation of this area would mark a material “lower low” likely opening the path to an eventual retest of the 200-day moving average.
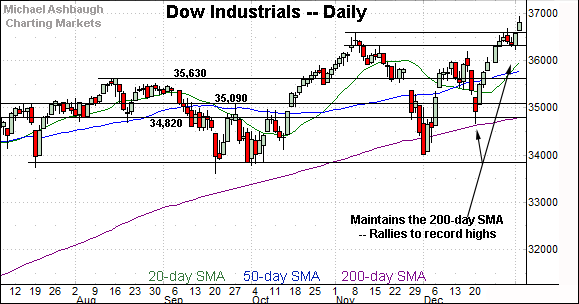
Looking elsewhere, the Dow Jones Industrial Average has broken out.
The prevailing upturn punctuates a bull flag — the tight late-December range — placing the Dow in record territory.
More broadly, the prevailing upturn originates from a successful test of the 200-day moving average. Constructive price action.
Meanwhile, the S&P 500 is digesting a respectable December break to record territory.
Recall the prevailing upturn punctuates a successful test of its former breakout point (4,545).
More immediately, the prevailing bull flag — the tight six-session range — is a bullish continuation pattern.
The bigger picture
As detailed above, the U.S. benchmarks’ bigger-picture backdrop remains uneven.
On a headline basis, the S&P 500 and Dow industrials are digesting recent breaks to all-time highs.
Meanwhile, the Nasdaq Composite has not broken out, and is vying to simply maintain a posture atop its 50-day moving average.
The prevailing divergence exemplifies a familiar rotation, in this case toward the “re-opening trade” and away from the “stay-at-home trade.”
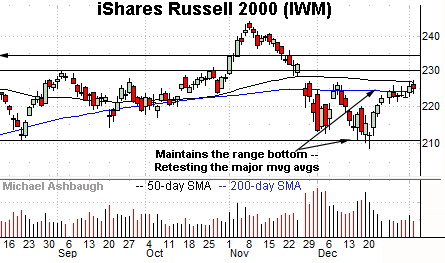
Moving to the small-caps, the iShares Russell 2000 ETF has weathered a major technical test.
Specifically, the small-cap benchmark has rallied from its range bottom, though amid decreased volume.
Tactically, an extended test of the 50-day moving average, currently 226.58, and 200-day moving average, currently 223.96, remains underway.
Follow-through atop the trending indicators would mark technical progress.
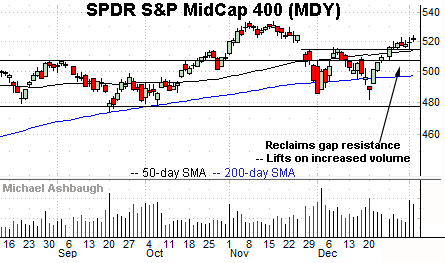
Meanwhile, the SPDR S&P MidCap 400 ETF continues to outpace the Russell 2000.
As illustrated, the MDY has filled the late-November gap — (the omicron-fueled gap) — rising modestly, though amid increased volume.
The prevailing upturn places record territory within striking distance.
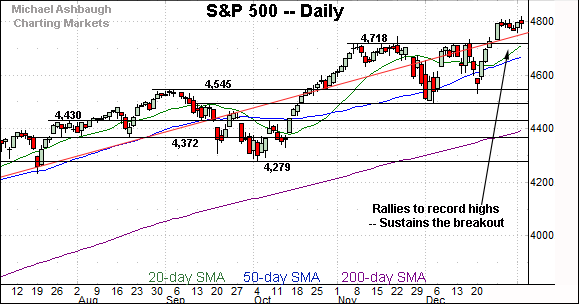
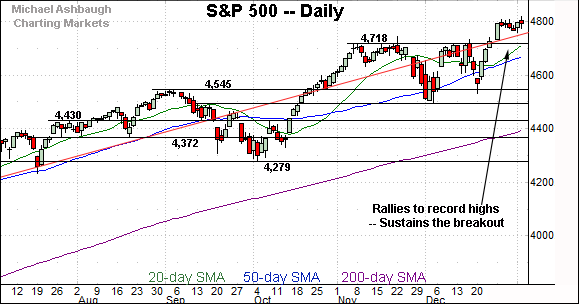
Placing a finer point on the S&P 500, the index has sustained a December break to record territory.
The prevailing tight range is a bullish continuation pattern hinged to the steep rally from major support (4,545).
More broadly, the S&P 500 has asserted a bull flag near the 4,800 mark.
Tactically, the breakout point — the 4,713-to-4,718 area — marks its first notable support.
Delving deeper, the 50-day moving average, currently 4,671, is rising toward support.
More broadly, likely last-ditch support matches the S&P 500’s former breakout point (4,545). Recall last month’s respectable bullish reversal from support, fueled by nearly 7-to-1 positive breadth.
As always, it’s not just what the markets do, it’s how they do it.
But generally speaking, the S&P’s backdrop supports a bullish intermediate-term bias barring a violation of the 4,545 area.
Watch List
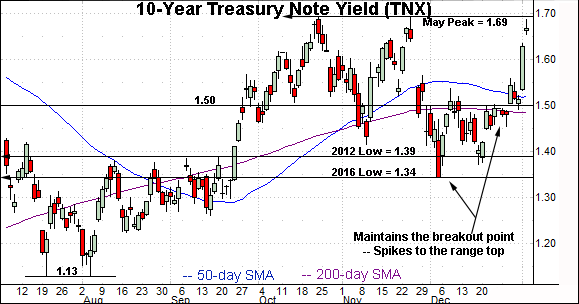
Drilling down further, the 10-year Treasury note yield has taken flight to start 2022.
The prevailing upturn places its range top (1.69) — a level matching the May, October and November peaks — under siege.
The week-to-date peak (1.686) has matched the inflection point.
Separately, the early-January spike places the yield back atop its 50-day moving average (in blue) a recently useful intermediate-term trending indicator.
More broadly, the prevailing upturn originates from a headline inflection point matching the 2016 low (1.34). Recall this is the point from which the plunge to pandemic-zone territory originated. (See the Sept. 8 review, as the yield’s breakout was taking shape.)
Though still early, the yield’s January surge resembles the strong 2021 start, a move that would ultimately span 75 basis points across about 10 weeks.
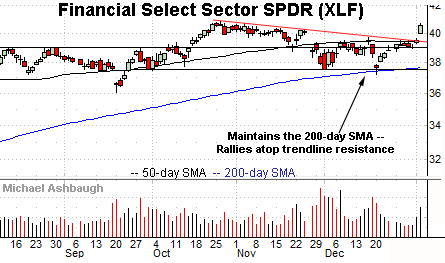
Moving to U.S. sectors, the Financial Select Sector SPDR is off to a strong 2022 start.
Very generally, banks benefit from rising yields in the form of an improved rate spread, or the diference between the rate at which a bank borrows, and the rate it subsequently lends to customers.
Against this backdrop, the group has staged a trendline breakout, rising within view of its record high (40.86) on increased volume.
Tactically, trendline support closely matches the group’s 50-day moving average, currently 39.40. A sustained posture higher signals a bullish bias.
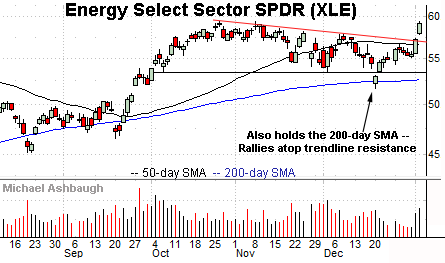
Similarly, the Energy Select Sector SPDR has come to life, rising at least partly amid firming energy prices.
Fundamentally, rising energy prices and interest rates might conventionally present a market headwind.
But against the current backdrop, the tandem resurgence more likely reflects improved global-growth expectations — a.k.a. the re-opening trade — amid a recently tamer-than-feared virus overhang.
Like the financials, the XLE’s prevailing upturn originates from a successful test of the 200-day moving average at the December low.
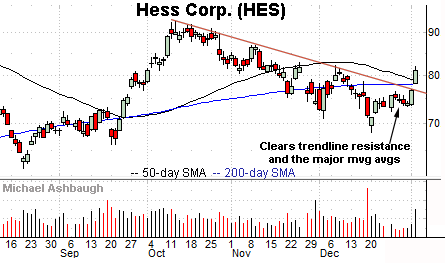
Moving to specific names, Hess Corp. is a large-cap oil and gas name coming to life.
As illustrated, the shares have knifed atop trendline resistance, as well as the 50- and 200-day moving averages. The strong-volume breakout signals a trend shift.
Tactically, gap support (78.20) closely matches the 200-day moving average and is followed by the slighty deeper trendline. The prevailing rally attempt is intact barring a violation.
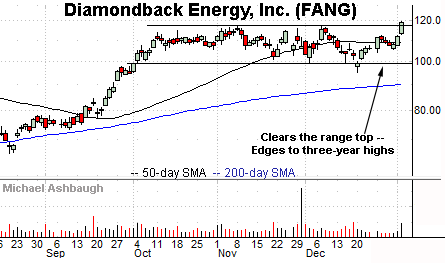
Diamondback Energy, Inc. is another well positioned large-cap oil and gas name.
Technically, the shares have tagged three-year highs, edging atop well-defined resistance.
The prevailing upturn punctuates an orderly three-month range — a bullish continuation pattern — hinged to the steep September rally. An intermediate-term target projects to the 130 area on follow-through.
Conversely, the breakout point (116.90) is followed by near-term support, circa 112.75.
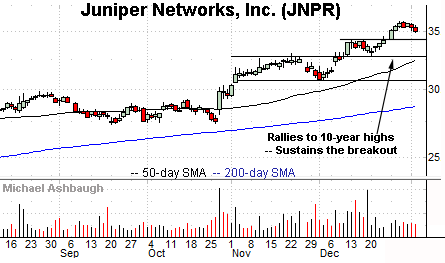
Finally, Juniper Networks, Inc. is a well postioned large-cap name. (Yield = 2.3%.)
Late last year, the shares reached 10-year highs, rising from a bull flag defined by the tight mid-December range.
The subsequent pullback has been comparably flat, placing the shares 2.7% under the December peak.
Tactically, the breakout point (34.20) is followed by the former range bottom (32.80). A sustained posture higher signals a bullish bias. (On a granular note, the 2015 peak (32.40) marks a one-decade breakout point, and pivots to notabe support.)


