S&P 500 survives major test, rallies amid nearly 7-to-1 up day
Focus: Health care sector sustains technical breakout, Dow 30 components McDonald's and Cisco Systems challenge record highs, XLV, MCD, CSCO, MRVL, JBL
Broadly speaking, the U.S. benchmarks’ bigger-picture backdrop remains uneven as a December divergence persists.
But amid the cross currents, each index has survived a major technical test this week. Specific levels include the S&P 500’s breakout point (4,545), the Nasdaq 14,860 area and the Dow’s 200-day moving average.
Editor’s Note: As always, updates can be directly accessed at chartingmarkets.substack.com.
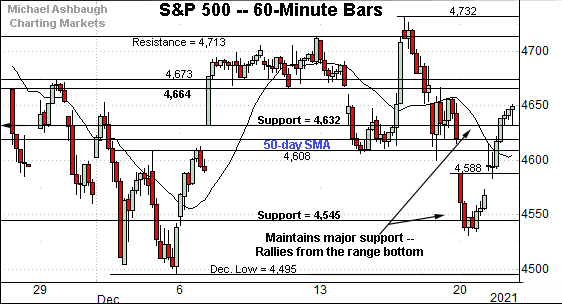
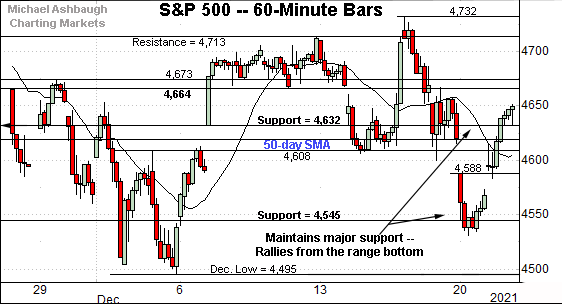
Before detailing the U.S. markets’ wider view, the S&P 500’s hourly chart highlights the past four weeks.
As illustrated, the S&P has weathered a second December test of major support (4,545).
The prevailing upturn places it back within the former range — roughly spanning from 4,608 to 4,713 — to punctuate a Fed-induced market whipsaw.
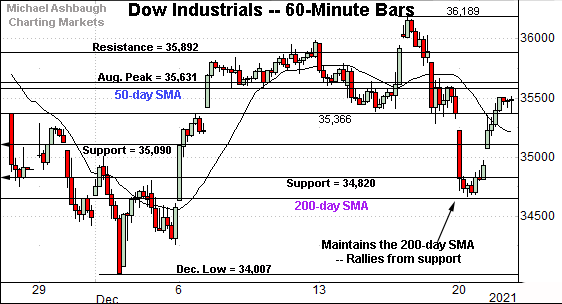
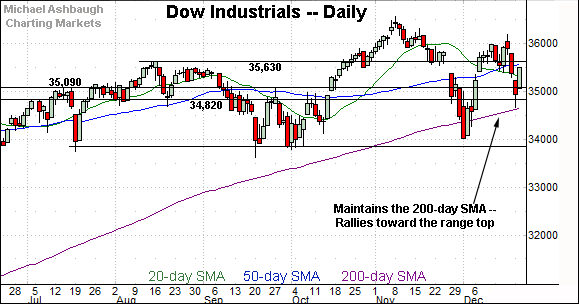
Meanwhile, the Dow Jones Industrial Average has survived a more significant technical test.
Specifically, the index has successfully tested its 200-day moving average, currently 34,657.
As always, the 200-day moving average is a widely-tracked longer-term trending indicator.
The prevailing upturn places the Dow back atop gap support (35,366) a level defining the former range.
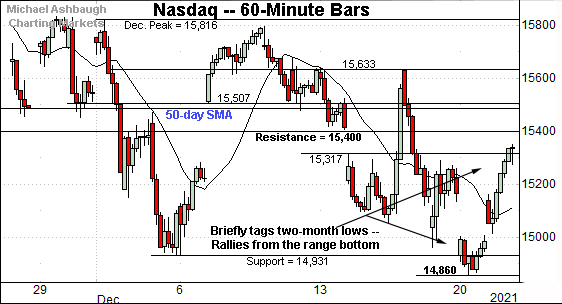
Against this backdrop, the Nasdaq Composite remains the weakest index, briefly tagging two-month lows, unlike the other benchmarks.
But on a positive note, the Nasdaq has maintained its next significant support — the 14,860 area — better illustrated on the daily chart below.
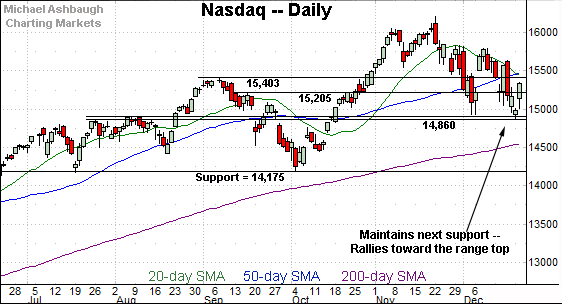
Widening the view to six months adds perspective.
On this wider view, the Nasdaq has rallied from its next notable floor.
Consider that the December low (14,860) has closely matched the July peak (14,863).
(This area was previously tagged more broadly, technically spanning from 14,803 to 14,896.)
The prevailing upturn punctuates a second December test of this general area, also detailed on the hourly chart.
On further strength, the former breakout point (15,400) is followed by the 50-day moving average, currently 15,492. Sustained follow-through atop this area would signal a bullish-leaning intermediate-term bias.
Conversely, downside follow-through under major support (14,860) would mark a material “lower low” likely opening the path to an eventual retest of the 200-day moving average.
Looking elsewhere, the Dow Jones Industrial Average has weathered a major technical test.
Specifically, the index has rallied respectably from its 200-day moving average, currently 34,658.
The prevailing upturn places the former breakout point (35,630) within view.
More broadly, the prevailing bigger-picture backdrop is in flux.
The late-November omicron-fueled gap lower — followed by the Fed’s unexpectedly hawkish-leaning policy language, just two sessions later — has been punctuated by a less pronounced mid-December whipsaw, fueled by largely the same two catalysts.
Tactically, a sustained posture atop the former range top (35,090) — (also the October breakout point) — signals a bullish-leaning bias.
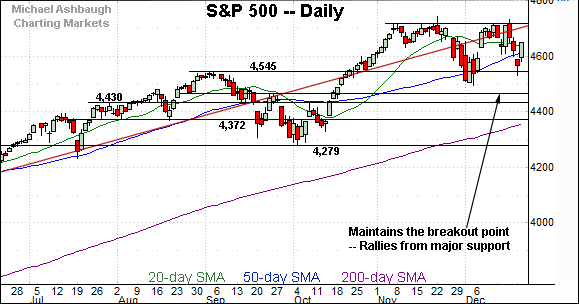
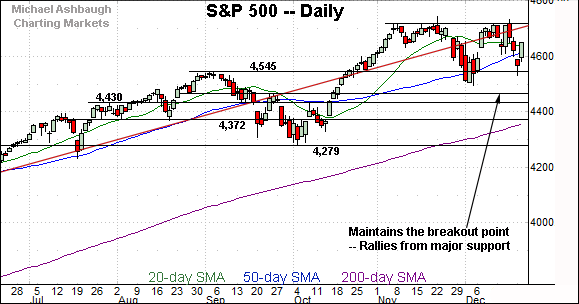
Meanwhile, the S&P 500 has weathered a second recent test of its breakout point (4,545).
The bullish reversal places its back atop the 50-day moving average, currently 4,620.
The bigger picture
As detailed above, the major U.S. benchmarks remain in divergence mode. Each backdrop is different, in key respects.
But amid the cross currents, each index has survived a major technical test this week. See the successful tests of S&P 4,545, Nasdaq 14,860 and the Dow’s 200-day moving average.
Constructive price action, in the broad sweep.
Moving to the small-caps, the iShares Russell 2000 ETF has also maintained major support — the 209.05-to-210.70 area.
Still, the prevailing backdrop remains bearish-leaning.
The small-cap benchmark has asserted a posture under its 200-day moving average, while recent rally attempts have been fueled by decreased volume.
Tactically, an eventual violation of the prevailng range bottom would raise a technical red flag. (See the five-year chart.)
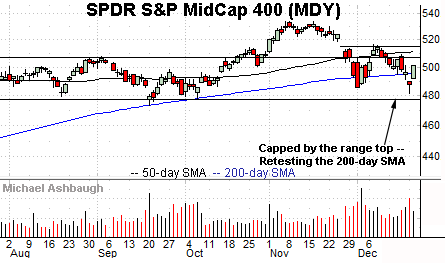
Meanwhile, the SPDR S&P MidCap 400 ETF has also registered shaky December price action.
A volatile retest of the 200-day moving average, currently 495.54, remains underway.
Here again, the MDY’s recent rally attempts have been fueled by decreased relative volume.
Placing a finer point on the S&P 500, the index has rallied back to its former range.
To reiterate, the bullish reversal places it back atop the 50-day moving average — and gap support (4,632) — to punctuate a Fed-fueled whipsaw.
More broadly, the S&P 500 has rallied respectably from major support (4,545).
And perhaps surprisingly, the prevailing upturn has been fueled by unusually strong market breadth, approaching bullish extremes. For instance, Tuesday’s NYSE advancing volume surpassed declining volume by a nearly 7-to-1 margin.
Against this backdrop, the S&P’s successful retest would seem to reduce the prospect of a major trend shift through year-end.
Tactically, familiar inflection points remain in play.
To start, the S&P’s 50-day moving average, currently 4,620 is followed by the more important breakout point (4,545).
Delving deeper, likely last-ditch support matches the December closing low (4,513) and absolute December low (4,495).
As detailed repeatedly, an eventual violation of the 4,500 area would punctuate a double top — defined by the November and December peaks — raising the flag to a potentially consequential trend shift.
Barring such a move, the S&P 500’s intermediate-term bias remains bullish, based on today’s backdrop.
Editor’s Note: This is the final 2021 review. Charting Markets will return Wednesday, Jan. 5. Have a great holiday!
Watch List
Drilling down further, the Health Care Select Sector SPDR is acting well technically. (Yield = 1.4%.)
As illustrated, the group has recently tagged record highs, clearing resistance matching the August peak on increased volume.
The subsequent pullback has been comparably flat, placing the group 1.7% under the December peak.
Tactically, the former range top (135.30) is followed by the ascending 50-day moving average, currently 132.85. A sustained posture higher signals a bullish bias.
Moving to specific names, McDonald’s Corp. is a well positioned Dow 30 component. (Yield = 2.1%.)
Earlier this month, the shares knifed to all-time highs, clearing resistance matching the November peak.
The subsequent flag-like pattern signals still muted selling pressure — even amid a volatile market — positioning the shares to build on the steep early-December rally.
Tactically, a sustained posture atop the breakout point (257.80) signals a firmly-bullish bias.
Similarly, Cisco Systems, Inc. is another well positioned Dow 30 component. (Yield = 2.4%.)
As illustrated, the shares have tagged record highs, edging atop the August peak.
The prevailing upturn punctuates a tight three-session range, laying the groundwork for potentially more decisive follow-through.
Tactically, a breakout attempt is in play barring a violation of the former range top (58.20).
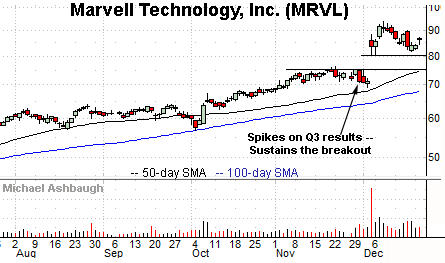
Marvell Technology, Inc. is a well positioned large-cap semiconductor name.
Earlier this month, the shares gapped to record territory, rising sharply after the company’s strong third-quarter results.
The subsequent pullback has been orderly, placing the shares 8.7% under the December peak.
Tactically, the post-breakout low (81.60) is closely followed by gap support (80.50).
Finally, Jabil, Inc. is a well positioned large-cap contract manufacturer.
The shares initially spiked about two weeks ago, gapping to the range top amid a volume spike after the company’s strong first-quarter results.
The subsequent pullback filled the gap, and has been underpinned by the 50-day moving average.
More immediately, the prevailing bull-flag breakout, of sorts, places the shares at all-time highs. Tactically, the breakout point (65.80) is followed by gap support (63.00) closely matching the 50-day moving average.
More broadly, the prevailing upturn originates from a successful test of the 200-day moving average at the December low.
Editor’s Note: This is the final 2021 review. Charting Markets will return Wednesday, Jan. 5. Have a great holiday!


