Charting a bull-trend whipsaw, S&P 500 reverses from record highs
Focus: Health care sector sustains April breakout, Facebook takes flight amid earnings-fueled breakout, XLV, FB, CVS, STLD, FAST
Technically speaking, the major U.S. benchmarks are concluding April — and the best six months seasonally — against a still comfortably bullish bigger-picture backdrop.
Editor’s Note: As always, updates can be accessed at chartingmarkets.substack.com. Your smartphone smartphone can also access updates at the same address, chartingmarkets.substack.com.
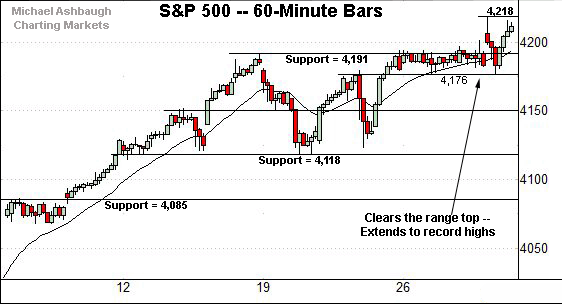
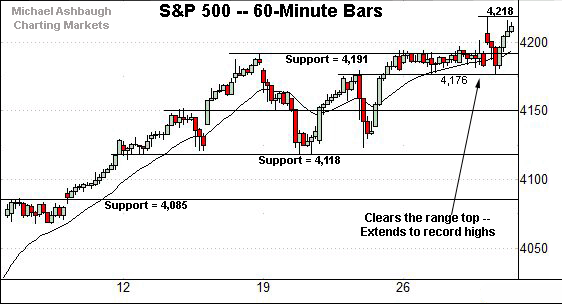
Before detailing the U.S. markets’ wider view, the S&P 500’s hourly chart highlights the past four weeks.
As illustrated, the S&P has registered a jagged break to record highs.
Tactically, the breakout point (4,191) is followed by the former range bottom (4,176).
Slightly more broadly, the prevailing upturn punctuates an unusually tight early-week range.
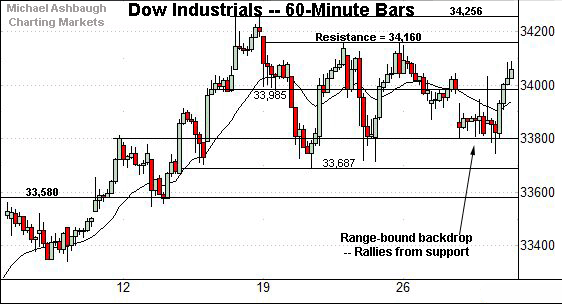
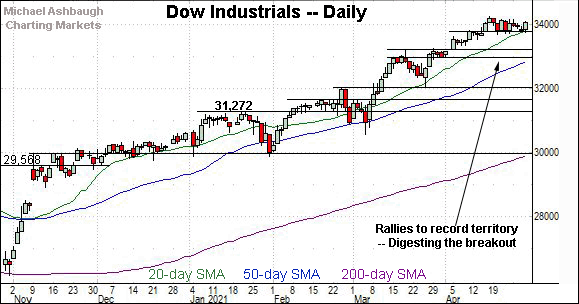
Meanwhile, the Dow Jones Industrial Average remains range-bound.
Tactically, the 33,985 area has marked an inflection point, and is followed by near-term support, circa 33,800.
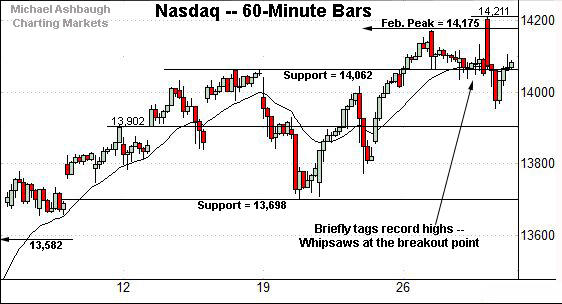
Against this backdrop, the Nasdaq Composite has whipsawed amid a breakout attempt.
Consider that Thursday’s session high (14,211) marked an all-time high, though the index swiftly reversed back to its range.
Tactically, the former breakout point (14,062) — detailed previously — is followed by the week-to-date low (13,952) and a former gap, circa 13,900.
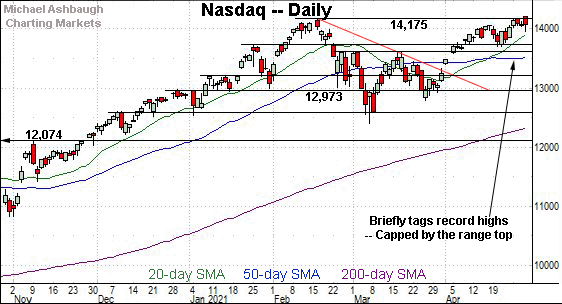
Widening the view to six months adds perspective.
On this wider view, the Nasdaq registered a bearish single-day reversal Thursday to punctuate an intraday record high.
Still, the single-day whipsaw did not register as a bearish engulfing pattern or key reversal. An extended breakout attempt remains underway in the broad sweep.
Looking elsewhere, the Dow Jones Industrial Average remains in consolidation mode.
Recall the relatively tight late-April range is a bullish continuation pattern.
Tactically, near-term support, circa 33,800, is followed by prevailing range bottom (33,687), areas also illustrated on the hourly chart.
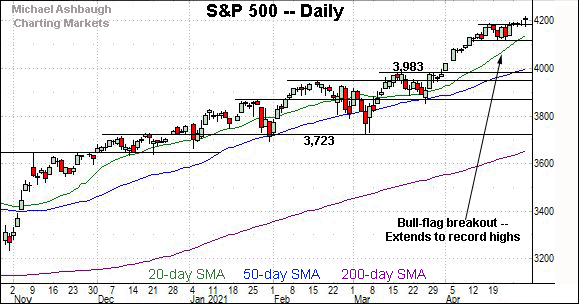
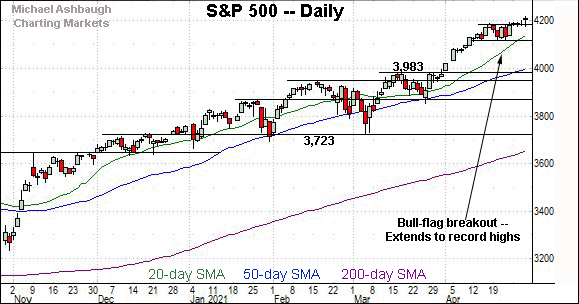
Meanwhile, the S&P 500 has staged a bull-flag breakout.
The late-week follow-through punctuates a tight mid-April range. A near- to intermediate-term target projects to the 4,265 area, detailed previously.
The bigger picture
U.S. stocks are lower early Friday, pressured at least partly by a soft batch of global economic data.
Friday also concludes the best six months seasonally — November through April — though the U.S. benchmarks’ prevailing technicals remain constructive. (The best six-month seasonal period is a global market phenomenon, not limited to the U.S. markets.)
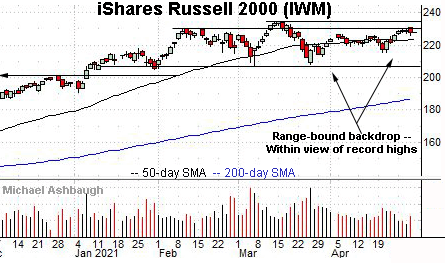
Moving to the small-caps, the iShares Russell 2000 ETF remains range-bound.
Tactically, the Feb. peak (230.30) remains a hurdle, notwithstanding Thursday’s brief intraday tick above the inflection point.
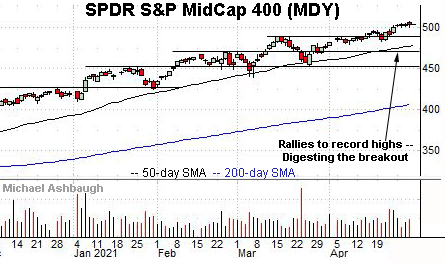
Meanwhile, the SPDR S&P MidCap 400 remains incrementally stronger.
Still, the MDY has flatlined to conclude April, digesting a mid-month break to record territory.
Placing a finer point on the S&P 500, the index has whipsawed amid a late-month breakout attempt.
Tactically, the breakout point (4,191) is followed by the former range bottom (4,176).
More broadly, the S&P’s mid-April range bottom (4,118) is followed by an inflection point matching its former projected target (4,085).
Delving deeper, the S&P’s 50-day moving average, currently 4,003, is followed by the breakout point (3,983). Broadly speaking, a sustained posture atop the 3,980-to-4,000 area signals a bullish intermediate-term bias.
Beyond specific levels, Friday’s monthly close concludes the best six months seasonally, and next week’s turn-of-the-month price action will likely add color.
Friday’s Watch List
Drilling down further, consider the following sectors and individual names:
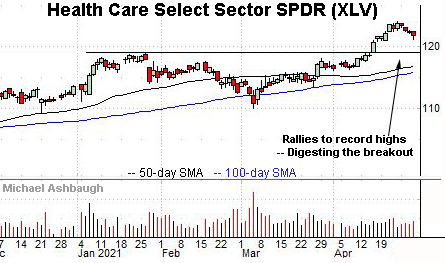
To start, the Health Care Select Sector SPDR is acting well technically. (Yield = 1.5%.)
Earlier this month, the group knifed to all-time highs, clearing resistance matching the January peak.
The ensuing pullback has been comparably flat, placing the group 1.9% under the April peak.
Tactically, the post-breakout low (120.90) is followed by the firmer breakout point (119.00). A sustained posture higher signals a firmly-bullish bias.
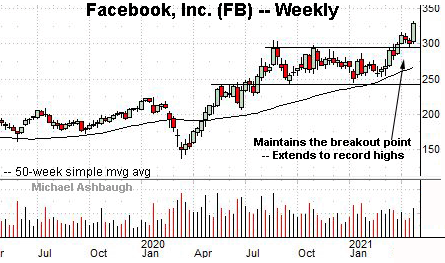
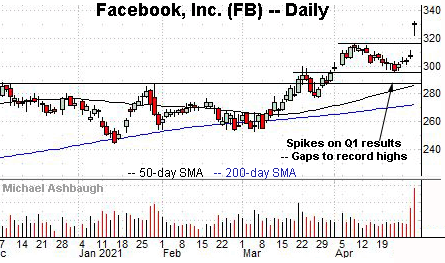
Moving to specific names, Facebook, Inc. has taken flight.
Specifically, the shares have knifed to record highs, gapping sharply higher after the company’s strong first-quarter results.
Technically, the prevailing upturn originates from support roughly matching the 2020 range top. (See the weekly chart.) An intermediate-term target projects to the 345 area.
More immediately, the shares are near-term extended — following the strong-volume spike — and due to consolidate. Tactically, gap support (321.61) is followed by the firmer breakout point (315.90).
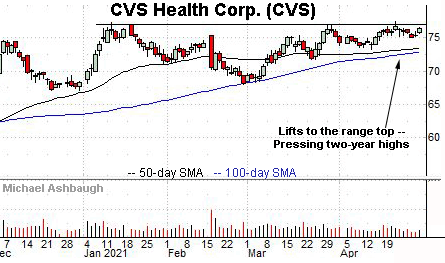
CVS Health Corp. is a large-cap pharmacy retailer showing signs of life. (Yield = 2.6%.)
As illustrated, the shares have rallied toward the range top, rising to press two-year highs. The prevailing upturn punctuates a modified head-and-shoulders bottom.
Tactically, recent persistence near the range top (77.00) improves the chances of an eventual breakout. A near-term target projects to the 81 area on follow-through.
Note the company’s quarterly results are due out May 4.
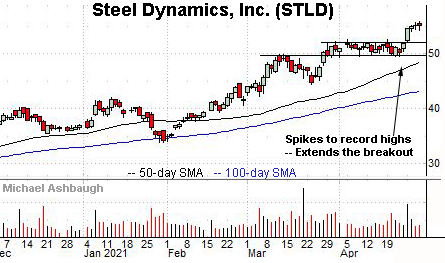
Steel Dynamics, Inc. is a well positioned large-cap name. (Yield = 1.9%.)
Technically, the shares have knifed to record territory, rising from a tight three-week range. The prevailing upturn marks an unusually strong two standard deviation breakout, encompassing four straight closes atop the 20-day Bollinger bands. (Bands not illustrated.)
The near-term extended — and due at least a sideways chopping-around phase — the decisive breakout is longer-term bullish. The former range top, circa 52.20, pivots to support.
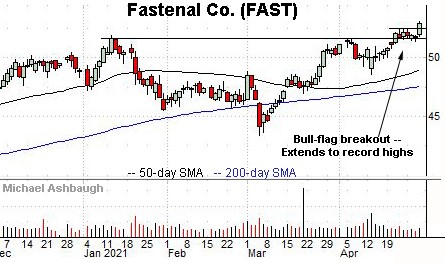
Finally, Fastenal Co. is a large-cap industrial and construction supplies distributor. (Yield = 2.1%.)
As illustrated, the shares have staged a modest bull-flag breakout, tagging record highs from a tight one-week range. A near-term target projects to the 55 area.
Conversely, near-term support (52.50) is followed by the former breakout point (51.60). A sustained posture atop this area signals a comfortably bullish bias.


