Charting a bull flag, S&P 500 holds near-term support
Focus: Semiconductor sector tags record high, AMD's massive earnings-fueled breakout, SMH, AMD, WMT, F, UA
U.S. stocks are mixed early Wednesday, vacillating after a mixed batch of economic data and a round of generally strong quarterly earnings reports.
Against this backdrop, the S&P 500 remains range-bound, pulling in modestly from its latest record close.
Meanwhile, the Dow Jones Industrial Average has pulled in toward major support (34,821) from a nominal record high established to start this week.
Editor’s Note: As always, updates can be directly accessed at chartingmarkets.substack.com.
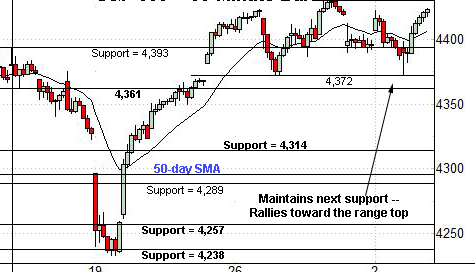
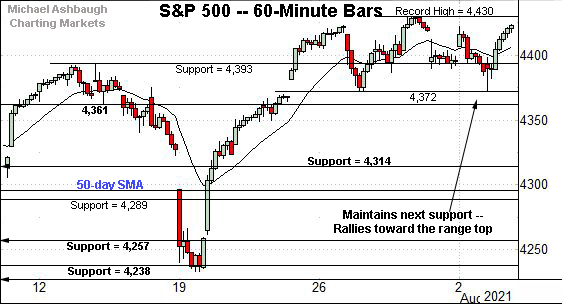
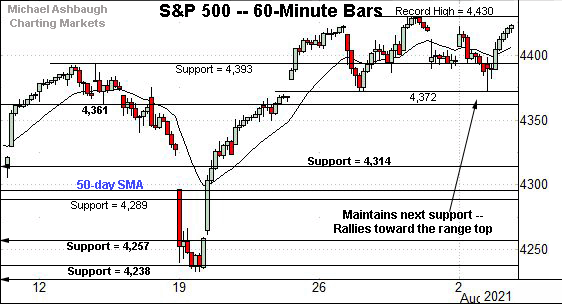
Before detailing the U.S. markets’ wider view, the S&P 500’s hourly chart highlights the past four weeks.
As illustrated, the S&P has asserted a flag-like pattern — a nearly two-week range — hinged to the steep mid-July rally.
Tactically, Tuesday’s session low (4,373) closely matched the range bottom (4,272), detailed repeatedly.
The S&P subsequently rallied to register a nominal record close. Bullish price action.
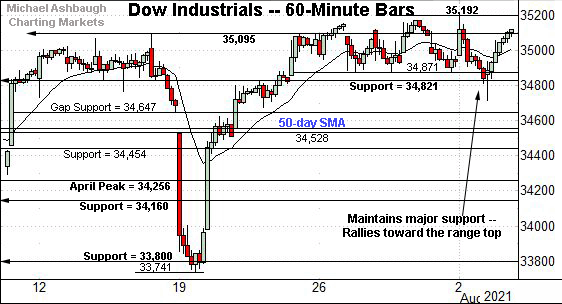
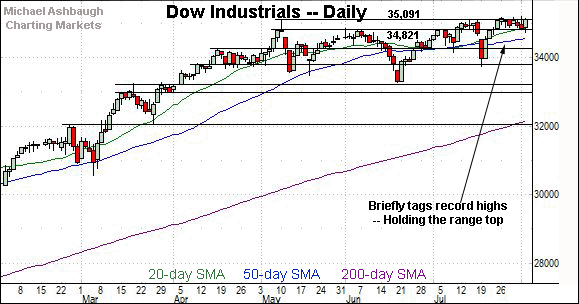
Similarly, the Dow Jones Industrial Average is holding its range top.
Here again, the relatively tight range — underpinned by major support (34,821) — is technically constructive.
Wednesday’s early session low (34,825) has closely matched support. The session close will likely add color.
Delving deeper, gap support (34,647) is followed by the 50-day moving average, currently 34,552.
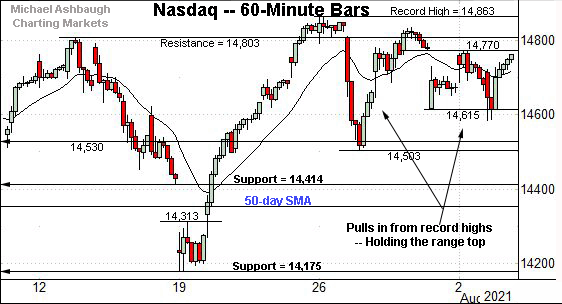
Against this backdrop, the Nasdaq Composite has registered slightly more jagged price action.
Though the July low (14,178) closely matched major support (14,175) — also illustrated below — the Nasdaq has subsequently registered less technical price action versus the other benchmarks.
Nonetheless, the index continues to hold relatively tightly to its range top.
Widening the view to six months adds perspective.
On this wider view, the Nasdaq continues to press its range top.
The prevailing near-term range — underpinned by the 20-day moving average — is hinged to the steep mid-July rally from the breakout point (14,175). Constructive price action.
More broadly, recall the mid-June breakout punctuated a double bottom defined by the March and May lows.
On further strength, a near- to intermediate-term target continues to project to the 15,420 area. (See the July 26 review.)
Looking elsewhere, the Dow Jones Industrial Average is challenging record highs.
In fact, Monday’s early session high (35,192) marked a nominal record amid a breakout attempt that remains underway.
The prevailing tight eight-session range signals muted selling pressure near resistance, improving the chances of eventual follow-through.
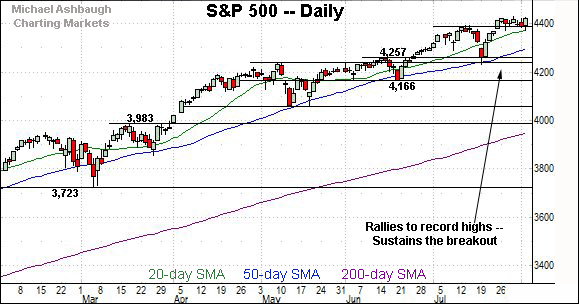
Meanwhile, the S&P 500 has asserted a bull flag near record highs.
Tactically, the breakout point (4,393) is followed by the 20-day moving average, currently 4,374.
The latter roughly matches the S&P’s range bottom (4,372) an area better illustrated on the hourly chart.
The bigger picture
As detailed above, the major U.S. benchmarks are off to a flattish, but generally constructive August start.
On a headline basis, the S&P 500 has sustained a slight break to record territory, while the Dow industrials’ more prolonged breakout attempt remains underway.
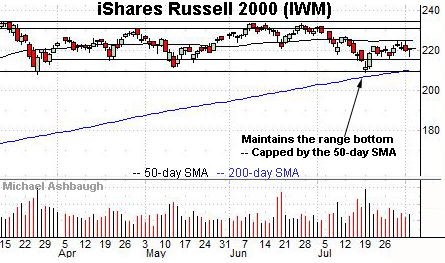
Moving to the small-caps, the iShares Russell 2000 ETF remains range-bound.
Consider that the 50-day moving average, currently 225.00, roughly bisects the range, consistent with trendless price action.
Meanwhile, the SPDR S&P MidCap 400 ETF has edged slightly atop its 50-day moving average, currently 490.77.
Combined, the small- and mid-cap benchmarks have sustained a reversal from the July low, though material upside follow-through thus far remains elusive.
Placing a finer point on the S&P 500, the index has asserted a nearly two-week range.
Tactically, recall Tuesday’s session low (4,373) closely matched the range bottom (4,272).
The index subsequently rallied to register a nominal record close (4,423.15) by a less than one-point margin. Constructive price action.
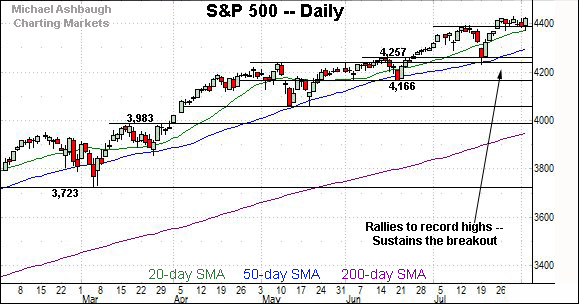
More broadly, the S&P 500’s six-month backdrop remains bullish.
Tactically, the S&P’s breakout point (4,393) is closely followed by the range bottom (4,272), areas also detailed on the hourly chart.
Delving deeper, the 50-day moving average, currently 4,298, is followed by the breakout point (4,257) and the July low (4,233). (Also see the May peak (4,238).)
So as detailed previously, major support broadly spans from 4,233 to 4,257. An eventual violation would mark a material “lower low” — combined with a violation of the 50-day moving average — raising a technical question mark.
The S&P 500’s intermediate-term bias remains bullish barring a violation of this area.
Beyond technical levels, the U.S. sub-sector backdrop has strengthened in recent sessions, amid market rotation and broadening participation, detailed last week. The response to Friday’s marquee monthly U.S. jobs report may add color.
Editor’s Note: The next review will be published Friday.
Watch List
Drilling down further, the VanEck Vectors Semiconductor ETF has broken out.
In the process, the group has reached record highs, clearing resistance matching the July peak.
Tactically, the breakout point pivots to support, circa 262.60, and is followed by the former range top (257.50). A posture higher signals a bullish bias.
Conversely, a near- to intermediate-term target projects from the summer range to the 278 area.
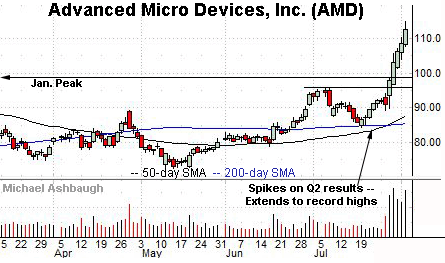
Advanced Micro Devices, Inc. is a large-cap semiconductor name taking flight.
Late last month, the shares knifed to record highs, rising after the company’s strong quarterly results.
More immediately, the prevailing follow-through has registered after the company unveiled a new product line, including a graphics chip that will be available in Apple’s Mac Pro desktops.
Though near-term extended, and due to consolidate, the sustained strong-volume spike is longer-term bullish. An eventual pullback toward the breakout point (99.20) would be expected to find support.
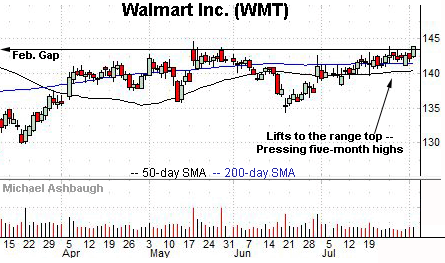
Walmart, Inc. is a Dow 30 component showing signs of life. (Yield = 1.5%.)
Technically, the shares have tagged a five-month closing high, edging atop resistance matching the May range top (143.50).
The prevailing upturn punctuates a relatively tight July range, underpinned by the 50- and 200-day moving averages.
Tactically, the 200-day moving average, currently 141.40, has marked an inflection point. A breakout attempt is in play barring a violation.
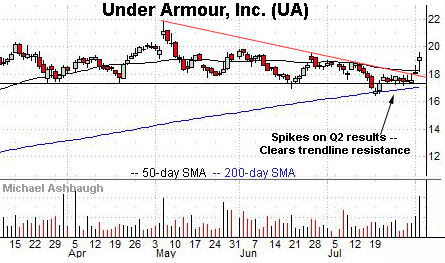
Under Armour, Inc. is a well positioned large-cap name.
As illustrated, the shares have knifed atop trendline resistance, rising after the company’s strong second-quarter results.
The breakout punctuates a July retest of the 200-day moving average, as well as support matching the March low (17.36) and April low (17.39).
Tactically, the trendline pivots to support. The prevailing rally attempt is intact barring a violation.
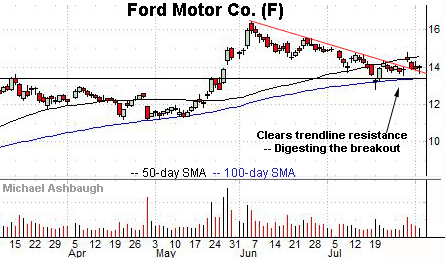
Finally, Ford Motor Co. is large-cap name coming to life.
Late last month, the shares cleared trendline resistance, gapping higher after the company’s quarterly results.
The subsequent pullback has been fueled by decreased volume, placing the shares near trendline support and 5.5% under the late-July peak.
Tactically, the 100-day moving average, currently 13.40, closely matches the May breakout point. A sustained posture higher signals a bullish bias. (Also see the May and July lows.)
Elsewhere, rival Tesla, Inc. — profiled last week — has extended its recent trendline breakout.
Editor’s Note: The next review will be published Friday.

