Charting a bull-bear stalemate, S&P 500 hesitates at major resistance (4,170)
Focus: Gold and silver challenge major resistance, Microsoft sustains earnings-fueled technical breakout, GLD, SLV, MSFT
Technically speaking, the major U.S. benchmarks have asserted a holding pattern, treading water amid a constructive August start.
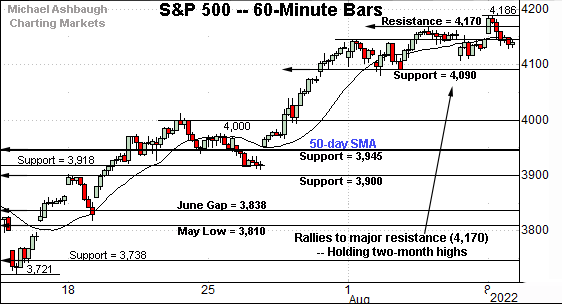
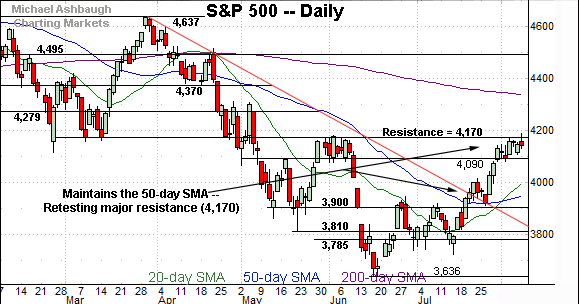
Against this backdrop, the S&P 500 continues to challenge major resistance (4,170) an area defining the U.S. markets’ headline bull-bear battleground.
Editor’s Note: As always, updates can be directly accessed at https://chartingmarkets.substack.com.
Before detailing the U.S. markets’ wider view, the S&P 500’s hourly chart highlights the past four weeks.
As illustrated, the S&P is off to a distinctly sideways August start.
The prevailing range has been underpinned by first support (4,090) detailed previously.
The August closing low (4,091) has registered nearby.
Conversely, the prevailing rally attempt has been capped by major resistance (4,170) an area also illustrated on the daily chart.
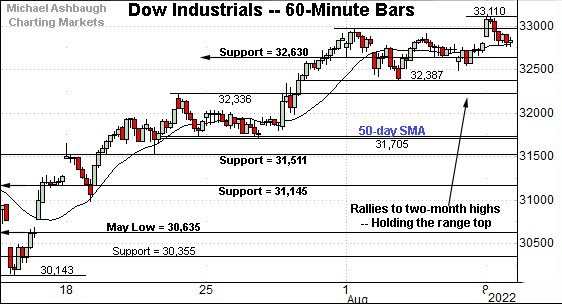
Similarly, the Dow Jones Industrial Average is off to a flattish August start.
Nonetheless, sideways price action is constructive against the current backdrop.
Tactically, the August range bottom (32,387) marks an inflection point.
Delving deeper, the 50-day moving average, currently 31,725, is followed by the firmer breakout point (31,510). A sustained posture atop this area signals a bullish intermediate-term bias.
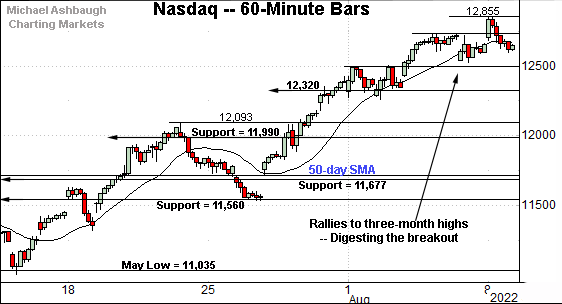
Against this backdrop, the Nasdaq Composite has strengthened slightly versus the other benchmarks, rising to tag three-month highs.
From current levels, the 12,500 mark is followed by the 12,320 inflection point, an area also detailed on the daily chart below.
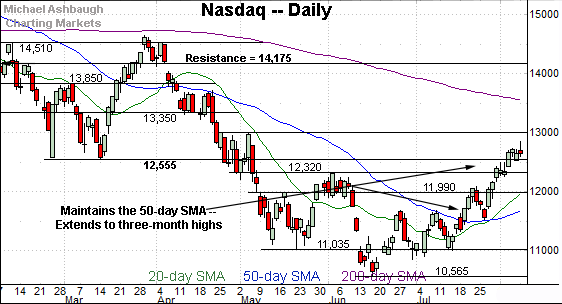
Widening the view to six months adds perspective.
On this wider view, the Nasdaq is digesting a sharp rally to three-month highs. Recall the prevailing upturn originates from a successful test of the 50-day moving average.
Tactically, the 12,525-to-12,555 area marks an inflection point. Slightly deeper support matches the June range top (12,320).
(On a granular note, recall the Nasdaq’s prevailing upturn has marked an unusually strong two standard deviation breakout, detailed previously.)
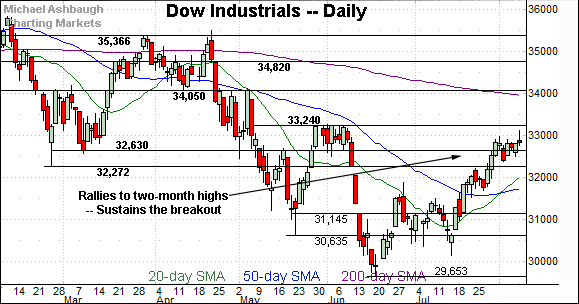
Looking elsewhere, the Dow Jones Industrial Average is digesting a rally to two-month highs.
The flattish August start punctuates a flag-like pattern hinged to the steep late-July rally. As always, the bull flag is a continuation pattern, laying the groundwork for potential upside follow-through.
Tactically, the 32,270 area remains a notable floor. (February low, June gap.)
Delving deeper, the 31,510-to-31,725 area marks more important support, levels matching the breakout point and the 50-day moving average. (Also see the hourly chart.)
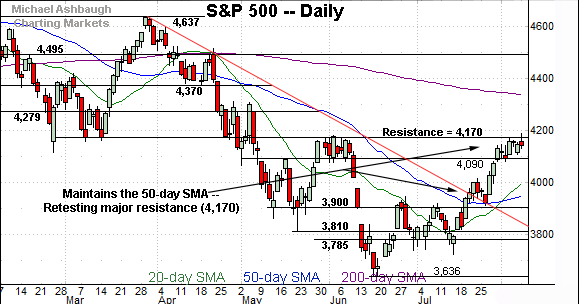
Meanwhile, the S&P 500 has reached a headline technical test.
The tight August range has been capped by major resistance (4,170), a familiar bull-bear inflection point detailed repeatedly.
Like the Nasdaq, the S&P 500’s prevailing upturn originates from a successful test of the 50-day moving average.
The bigger picture
As detailed above, the major U.S. benchmarks are off to a flattish, but still constructive, August start.
Each index is consolidating its aggressive late-July breakout, treading water amid thus far muted selling pressure.
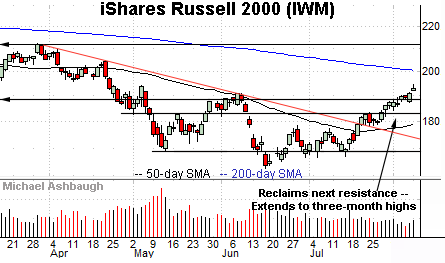
Moving to the small-caps, the iShares Russell 2000 ETF (IWM) has tagged three-month highs.
To reiterate, initial support (188.30) is followed by a deeper floor in the 182.50 area. A sustained posture atop this area signals a bullish intermediate-term bias.
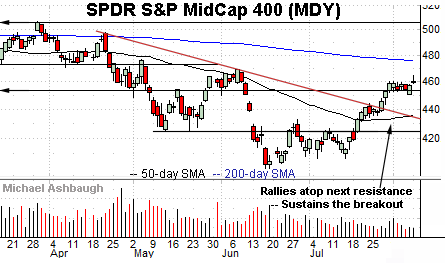
Meanwhile, the SPDR S&P MidCap 400 ETF (MDY) is off to an unusually flat August start.
Still, the prevailing bull flag — the tight one-week range — is a bullish continuation pattern.
As detailed previously, near-term support — the 452.60-to-453.40 area — closely matches the 100-day moving average, not illustrated. Delving deeper, the 50-day moving average roughly matches trendline support.
Returning to the S&P 500, the chart above highlights the U.S. markets’ headline bull-bear battleground.
As detailed previously, the May breakdown point (4,170) marks major resistance, likely the most significant overhead of the levels detailed above.
The tight August range signals a bull-bear stalemate near resistance.
(On a granular note, the mid-point of the prevailing six-month range rests at 4,137, and defines a related inflection point.)
Conversely, the August flag-like pattern has been underpinned by familiar support (4,090).
Delving deeper, the 4,000 mark is followed by an important floor in the 3,920-to-3,945 area. (The post-breakout closing low, and the 50-day moving average.)
Tactically, the S&P 500’s prevailing backdrop supports a bullish intermediate-term bias barring a violation of the 3,920 area. The response to Wednesday’s consumer inflation report (CPI) will likely add color.
Watch List
Drilling down further, the iShares Silver Trust (SLV) has reached a headline technical test.
Specifically, the shares are challenging the breakdown point (19.00), a level roughly matching the 50-day moving average, currently 18.77.
Tactically, follow-through atop this area would confirm the late-July trend shift. The prevailing rally attempt is intact barring a violation of gap support (18.05).
Similarly, the SPDR Gold Shares ETF (GLD) is approaching a major technical test.
Here again, the shares are pressing the 50-day moving average, currently 166.60, an area closely followed by the firmer breakdown point (168.30).
Tactically, the prevailing rally attempt is intact barring a violation of trendline support, circa 165.00.
Fundamentally, the precious metals have surged as Treasury yields show signs of stabilizing.
Finally, Microsoft Corp. (MSFT) is a well positioned Dow 30 component.
Late last month, the shares knifed to three-month highs, clearing the 50-day moving average amid increased volume after the company’s second-quarter results.
The subsequent flag-like pattern — the tight August range — has formed amid decreased volume, positioning the shares to build on the initial spike. Tactically, a sustained posture atop the breakout point (274.60) signals a bullish intermediate-term bias.


