Charting a bull-bear battle, S&P 500's rally attempt (still) clashing with major resistance
Focus: 10-year Treasury note yield asserts the range, Crude oil's latest breakout attempt, Global market cross currents, IBM's stealth breakout, TNX, USO, FXI, EWJ, IEV, IBM
Technically speaking, the major U.S. benchmarks continue to flatline, vacillating as energy prices and Treasury yields broadly grind higher.
Against this backdrop, the S&P 500 and Dow industrials have thus far drawn muted selling pressure near major resistance — at S&P 4,170 and Dow 33,240 — amid a bull-bear stalemate that remains in play.
Editor’s Note: As always, updates can be directly accessed at https://chartingmarkets.substack.com.
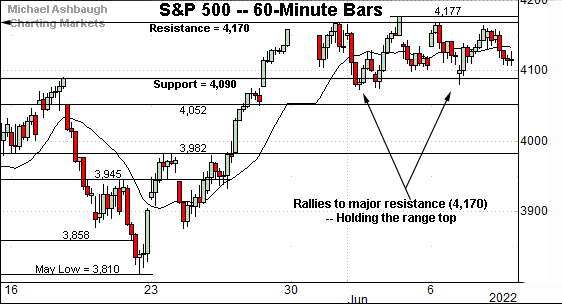
Before detailing the U.S. markets’ wider view, the S&P 500’s hourly chart highlights the past four weeks.
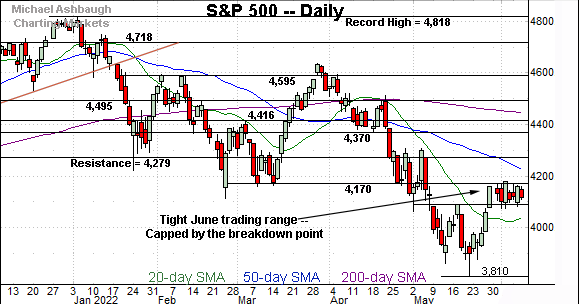
As illustrated, the S&P 500 has asserted a tight June range, capped by major resistance (4,170), detailed repeatedly.
The week-to-date high (4,168.8) and last week’s high (4,177) have registered nearby.
Tactically, the selling pressure near resistance remains muted, though the rally attempt has obviously thus far failed to follow-through. A bull-bear stalemate remains in play.
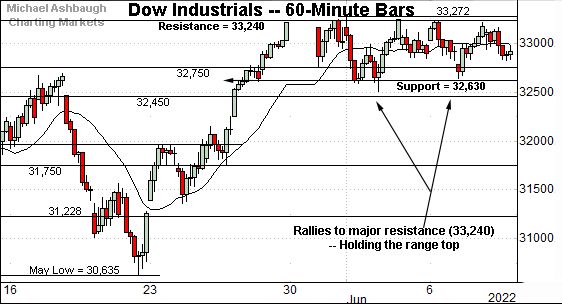
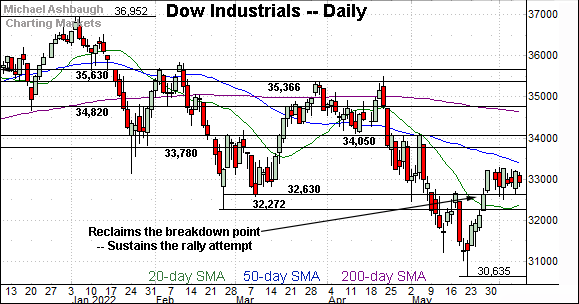
Similarly, the Dow Jones Industrial Average has asserted a tight June range.
Here again, the rally attempt has stalled near major resistance (33,240), an area detailed previously.
The week-to-date peak (33,235) has registered nearby.
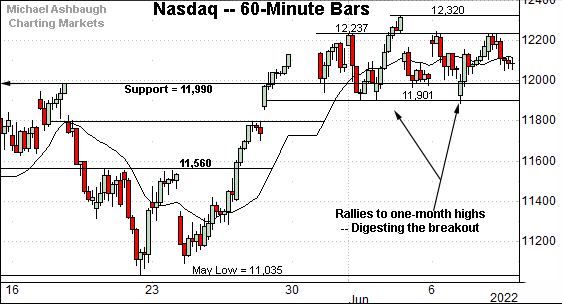
Against this backdrop, the Nasdaq Composite is also off to a flattish June start.
Tactically, the breakout point (11,990) is followed by support matching the 11,900 mark. (The June low technically rests at 11,888.)
The prevailing rally attempt is intact barring a violation of these areas.
(On a granular note, the June 8 peak (12,235) closely matched an overhead inflection point (12,237) detailed previously.)
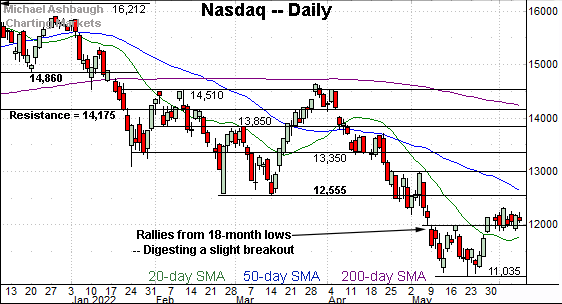
Widening the view to six months adds perspective.
On this wider view, the Nasdaq has sustained a modest break from the May range.
The tight June range remains flag-like, for now, postioning the index to build on the steep late-May rally.
Still, the longer the June range persists, it becomes less flag-like, and the absence of follow-through increases the risk of a bearish reversal. The next several sessions may add color.
(As detailed previously, the bull flag is a near-term pattern, and would be more reliable amid an uptrend rather than the prevailing primary downtrend. Nonetheless, trend shifts start somewhere, and the prevailing rally attempt is intact, based on today’s backdrop.)
Tactically, a sustained posture atop the 11,900 area preserves the Nasdaq’s recovery attempt. Its more important intermediate-term bias remains bearish pending follow-through atop the breakdown point (12,555) and the descending 50-day moving average, currently 12,592.
Looking elsewhere, the Dow Jones Industrial Average has sustained a more aggressive rally from the May low.
To reiterate, the Dow’s former breakdown point — the 32,630 area — remains an inflection point, detailed repeatedly. (See for instance, the June 2 review.)
The week-to-date low (32,641) has registered nearby. The prevailing recovery attempt is intact barring a violation of this area.
More broadly, eventual follow-through atop the 50-day moving average, currently 33,338, might strengthen the intermediate-term outlook.
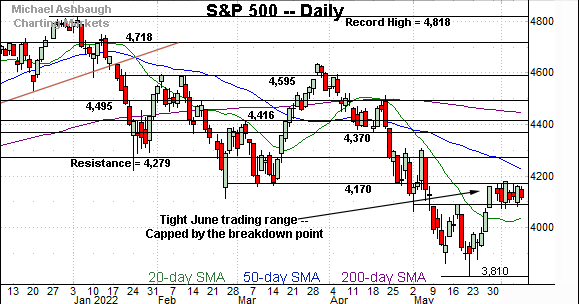
Meanwhile, the S&P 500’s backdrop exemplifies a familiar bull-bear tension.
Though the prevailing bull flag (the tight June range) is constructive, the pattern has been capped almost precisely by major resistance (4,170).
This area has marked a bull-bear inflection point going back as far as March.
Also see April 27: S&P 500 rallies from major support (4,170) even as bigger-picture backdrop deteriorates.
The bigger picture
As detailed above, the major U.S. benchmarks continue to tread water amid an increasingly sideways June start.
Against this backdrop, the respectable rally off the May low has thus far been capped by major resistance — the S&P 4,170 and Dow 33,240 areas.
Tactically, the prevailing rally attempt is intact, though amid a still firmly-bearish intermediate- to longer-term backdrop.
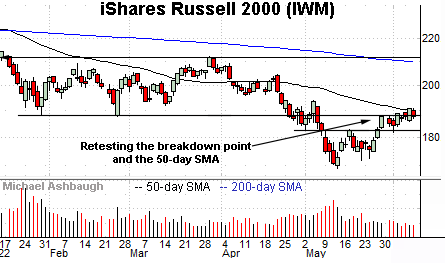
Moving to the small-caps, the iShares Russell 2000 ETF (IWM) continues to challenge its breakdown point — the 187.90-to-188.10 area, detailed previously.
Monday’s close (187.87) and Wednesday’s close (187.95) effectively matched resistance. (Tuesday’s close (190.90) registered atop resistance, though the immediate failure to sustain the slight breakout raises a question mark.)
Conversely, initial support (182.60) is closely followed by the June low (181.77).
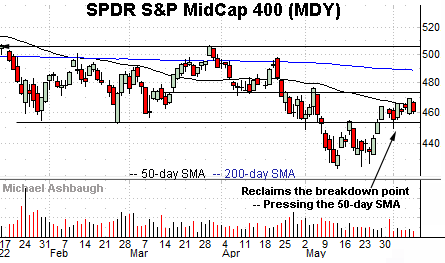
Meanwhile, the SPDR S&P MidCap 400 ETF (MDY) has sustained a rally atop its breakdown point (452.90), exhibiting relative strength versus the Russell 2000.
An extended test of the 50-day moving average, currently 462.96, remains underway.
Recall the 50-day moving average has marked a year-to-date inflection point.
Returning to the S&P 500, the index continues to flatline, digesting a bullish reversal off the May low.
Recall the late-May rally spanned as much as 9.1%, across just six sessions, originating from the May low, near the 3,800 target.
Tactically, the prevailing recovery attempt is intact barring a closing violation of the former range top (4,090).
Conversely, upside follow-through atop major resistance (4,170) likely opens the path to a higher plateau. Recall the 50-day moving average, currently 4,214, is descending within view.
Beyond near-term issues, the S&P 500’s bigger-picture trends remain bearish pending more extensive technical repairs.
Editor’s Note: The next review will be published Tuesday.
Watch List — Rising interest rates and energy prices
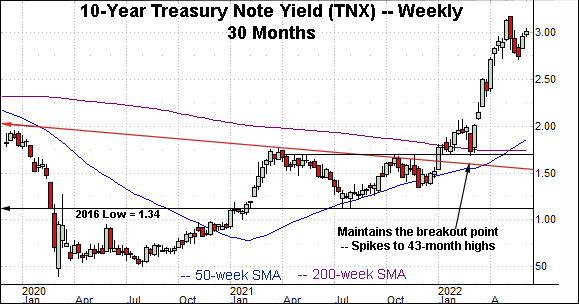
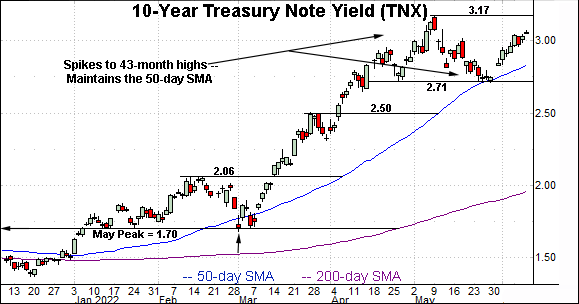
Drilling down further, the 10-year Treasury note yield (TNX) is digesting a massive 2022 breakout.
The initial leg higher — from the March low (1.70) to the May peak (3.17) — spanned 147 basis points, across about nine weeks, punctuating the yield’s fastest rate of change since the 1990’s.
Tactically, the 50-day moving average, currently 2.83, is followed by the prevailing range bottom. A sustained posture higher positions the yield to build on the massive initial spike.
Conversely, the 2018 peak (3.25) defines an 11-year range top, marking an important overhead inflection point. An eventual break higher opens the path to a less-charted patch, and a potentially significant incremental spike.
(On a granular note, recall the golden cross on the weekly chart — or bullish 50-week/200-week moving average crossover — an event that signaled last month.)
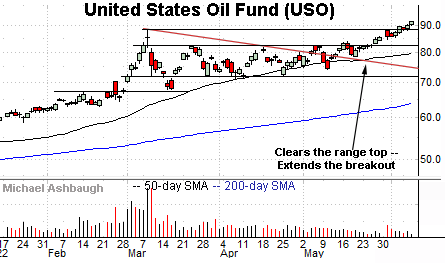
Meanwhile, the United States Oil Fund (USO) is once again breaking out. The fund tracks the spot price of light, sweet crude oil.
As illustrated, the shares have cleared a three-month range top, rising to start June in grinding-higher form.
Recent strength punctuates a bullish continuation pattern — (the relatively tight three-month range) — hinged to the aggressive early-March breakout. The prevailing upturn positions the shares to build on that initial spike.
Combined, rising energy prices and interest rates (yields) remain a broad-market headwind.
Beyond the U.S. — Global market cross currents persist
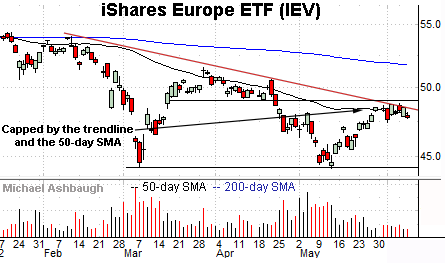
Beyond the U.S., the iShares Europe ETF (IEV) has reached a headline technical test.
Specifically, the shares are pressing trendline resistance roughly tracking the 50-day moving average. On further strength, the April breakdown point (49.10) marks additional overhead.
Tactically, the prevailing downtrend is intact pending follow-through atop these areas.
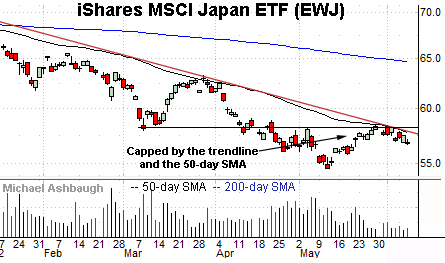
Similarly, the iShares MSCI Japan ETF (EWJ) has reached a key technical test.
Here again, the shares are challenging trendline resistance, in this case, very closely tracking the 50-day moving average.
Tactically, the prevailing downtrend is intact pending follow-through atop the trendline and the May peak (58.38).
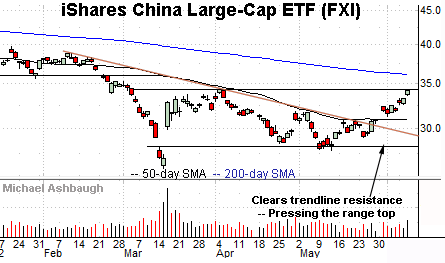
Meanwhile, the iShares China Large-Cap ETF (FXI) — profiled June 2 — has extended a trendline breakout.
Moreover, the shares have registered a “higher high” versus the early-May peak (31.69) confirming the trend shift.
Tactically, the prevailing rally attempt is intact barring a violation of the 30.90-to-31.70 area.
Conversely, the April peak (34.39) defines a three-month range top. The prevailing retest from underneath will likely add color. (Also see the May 18 review.)
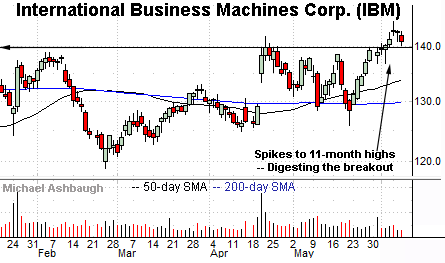
Concluding on a stray note, International Business Machines Corp. (IBM) is a Dow 30 component exhibiting surprising relative strength.
As illustrated, the shares have recently tagged 11-month highs, rising after the company announced plans to acquire cybersecurity specialist Randori, the company’s fourth acquisition this year.
Tactically, the breakout point — the 139.30-to-139.85 area — pivots to support. A sustained posture higher signals a firmly-bullish bias.


