Market bulls resurface, S&P 500 approaches headline technical test (4,170)
Focus: Financials and transports challenge major resistance, XLF, TRAN, XLP, XLE, XME
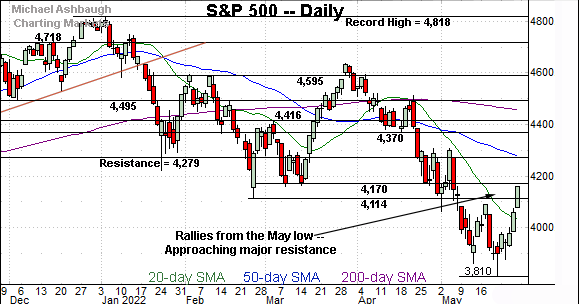
Technically speaking, the S&P 500 has reversed sharply from the May low, staging a massive six-session rally spanning as much as 9.1%.
The aggressive upturn has been punctuated by respectable internal strength — consecutive sessions on the order of 7-to-1 positive breadth — placing the S&P 500 within striking distance of a headline technical test (4,170). The monthly close, and the June start, will likely add color.
Editor’s Note: As always, updates can be directly accessed at https://chartingmarkets.substack.com.
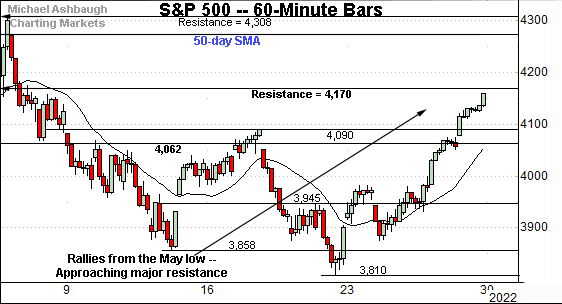
Before detailing the U.S. markets’ wider view, the S&P 500’s hourly chart highlights the past four weeks.
As illustrated, the S&P has extended a late-May rally attempt.
The prevailing upturn places major resistance (4,170) within striking distance.
Conversely, the 4,090 area pivots to support.
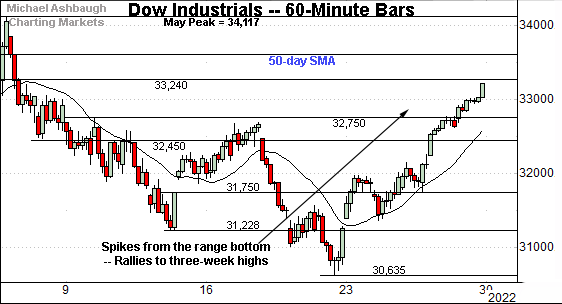
Similarly, the Dow Jones Industrial Average has reached three-week highs.
Tactically, the 32,750 area — detailed previously — pivots to support.
Tuesday’s early session low (32,752) has registered nearby. Contructive price action.
(Also recall last Wednesday’s session low (31,754) closely matched support (31,750).)
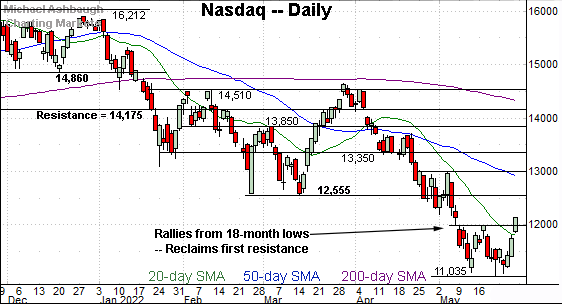
Against this backdrop, the Nasdaq Composite has also broken out.
The prevailing upturn punctuates a well-defined double bottom, defined by the May lows.
Tactically, the breakout point — 11,990 area — pivots to support.
Widening the view to six months adds perspective.
On this wider view, the Nasdaq seems to have escaped the mid-May range.
The prevailing upturn punctuates a double bottom, opening the path to a less-charted patch, capped by limited overhead.
From current levels, the breakdown point (12,555) marks major resistance. The 50-day moving average, currently 12,884, is descending toward the breakdown point.
Follow-through atop these areas would strengthen the intermediate-term bull case.
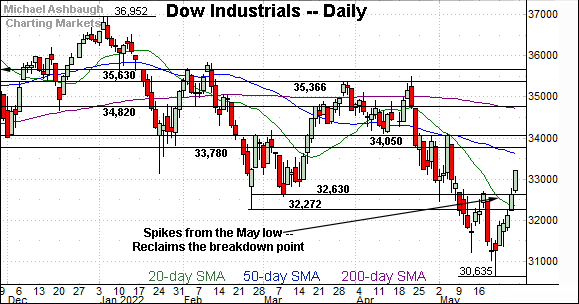
Looking elsewhere, the Dow Jones Industrial Average has extended a more aggressive bullish reversal.
Consider that the bull hammer — at the May low — has has been punctuated by upside follow-through, and five straight closes near session highs.
Tactically, the 32,630 area pivots to support. Thursday’s session close (32,637) registered nearby amid more recently technical price action.
The prevailing near-term rally attempt is intact barring a violation of the 32,630 area. The Dow’s bigger-picture trends remain bearish based on today’s backdrop.
Meanwhile, the S&P 500 has also knifed from the May low, bottoming slightly above the 3,800 mark.
Tactically, the breakdown point (4,170) marks major resistance, the area from which the steep March rally originated.
The bigger picture
As detailed above, market bulls have shown signs of a pulse to conclude May.
Each big three U.S. benchmark has extended an aggressive rally off recent lows, rising amid persistent bullish momentum. Amid the upturn, the Dow industrials have registered a six-session winning streak, while the S&P 500 has rallied across five of the prior six sessions.
Moving to the small-caps, the iShares Russell 2000 ETF (IWM) is approaching its breakdown point — the 187.90-to-188.10 area.
This area marks major resistance, and follow-through higher would strengthen the bull case.
Conversely, the 182.60 area pivots to support.
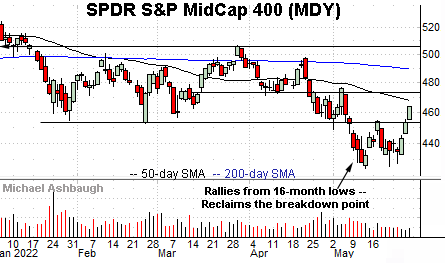
Meanwhile, the SPDR S&P MidCap 400 ETF (MDY) has reclaimed its breakdown point (452.90).
On further strength, the 50-day moving average, currently 467.50, is followed by the 473.30 area.
More broadly, recall the small- and mid-caps registered “higher lows” last week versus the May low, exhibiting relative strength versus the big three U.S. benchmarks.
But on a negative note, the small- and mid-caps have also rallied amid lackluster volume to conclude May.
Market breadth presses bullish extremes amid rally attempt
Moving to market breadth, last week’s sharp rally was fueled by unusually aggressive internal strength, pressing bullish extremes.
In fact, the bullish reversal has encompassed the strongest two-day rally internally in some time. (Though neither of the two sessions marked the year’s strongest single-day rally.)
On a headline basis, the NYSE registered consecutive rallies on the order of 7-to-1 positive breadth. Advancing volume surpassed declining volume by about a 7-to-1 margin.
And as always, two 9-to-1 up day across about a seven-session window, reliably signals a material trend shift. (The early-2019 rally originated from two 9-to-1 up days across a precisely seven-session window.)
Broaden the time frame slightly, to include the nearly 11-to-1 rally registered on May 13, and noteworthy bullish momentum has registered across an 11-session window. (See the May 16 review: Charting a bull-bear debate, S&P 500's 11-to-1 up day clashes with primary downtrend.)
So internally, the flag has been raised to a potentially material trend shift. Still, market bears will note that the rally has registered in the wake of comparably more aggressive selling pressure off the late-April peak.
(On a granular, but important note, the May 13 nearly 11-to-1 up day, was closely followed by a nearly 13-to-1 down day on May 18. It’s uninterupted bullish momentum that more reliably signals a trend shift.)
Returning to the S&P 500, the index has extended a respectable rally attempt.
Recall the May low (3,810) registered near the S&P’s downside target in the 3,800 area, detailed previously.
The index has subsequently spiked as much as 9.1% across just six sessions.
Against this backdrop, the prevailing upturn has registered promising traits — including most notably, the internal strength — though one glaring issue persists.
Namely, the S&P 500 has yet to reclaim significant resistance. The index has cleared notable near-term levels — detailed on the hourly chart — though it remains capped by its first major overhead (4,170).
Market bears might contend the rally’s aggressiveness is a function of the prior wide-ranging May downdraft, producing a less-charted patch, capped by limited resistance.
Tactically, the S&P 500’s breakdown point (4,170) remains a headline technical test, detailed repeatedly. (See the May 24 review, and prior reviews.) Recall the steep late-March rally originated from the 4,170 mark.
The pending retest of this area — to conclude May, and start June — should be a useful bull-bear gauge. The S&P’s bigger-picture trends remain bearish based on today’s backdrop.
Watch List — Repairing U.S. sub-sector damage
Drilling down further, the process of repairing extensive U.S. sub-sector damage may be underway. Several groups exemplify the prevailing backdrop:
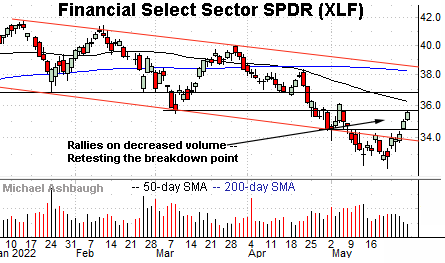
To start, the Financial Select Sector SPDR (XLF) has rallied respectably from 15-month lows.
Still, the upturn has been fueled by decreased volume, and thus far capped by the breakdown point (35.66).
Last week’s high (35.64) closely matched major resistance.
Tactically, follow-through atop the 35.60 area, and the descending 50-day moving average, currently 36.18, would strengthen the bull case.
Conversely, near-term support (34.50) is followed by the slightly deeper trendline.
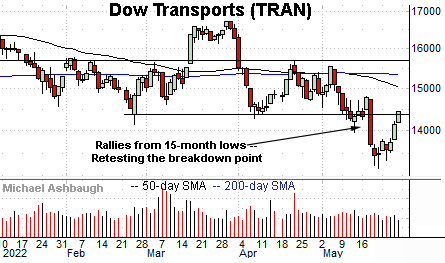
Similarly, the Dow Transports (TRAN) have reversed from 15-month lows.
Moreover, the group has ventured atop its breakdown point — the 14,375 area — closing last week (14,444) slightly higher. The pending upside follow-through, or lack thereof, is worth tracking.
Combined, the transports and financials are traditional sector leaders, and each has reached a headline technical test. The monthly close, and next several sessions, will likely add color. (Also see the May 20 review.)
Pockets of ‘relative’ sector strength persist
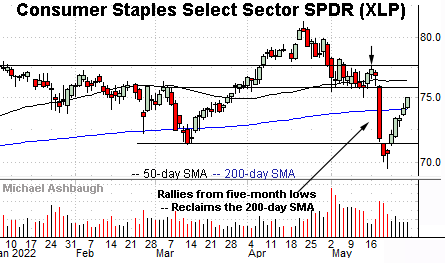
Looking elsewhere, the Consumer Staples Select Sector SPDR (XLP) remains relatively stronger than most other sectors.
The group has reversed sharply from five-month lows, rising to reclaim its 200-day moving average, currently 74.10. As always, the 200-day is a widely-tracked longer-term trending indicator.
On further strength, the May breakdown point (75.80) remains slightly more distant. Sustained follow-through atop this area would neutralize the May downdraft.
Meanwhile, the SPDR S&P Metals & Mining ETF (XME) is also exhibiting relative strength, maintaining a posture atop its 200-day moving average (in blue).
Moreover, the group has reclaimed first resistance, rising amid a single-day volume spike. Sustainability and follow-through, from current levels, remain open questions.
Tactically, the 53.50 area closely matches the 100-day moving average, and pivots to support. The group’s recovery attempt is intact barring a violation.
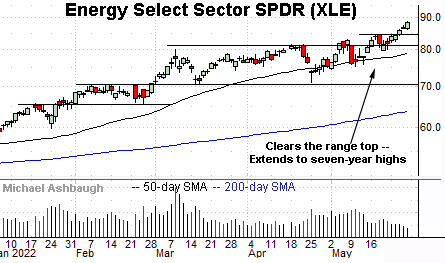
Finally, the Energy Select Sector SPDR (XLE) continues to outperform all other sectors. (Yield = 3.8%.)
As illustrated, the group has tagged its latest seven-year high, placing distance above the former range top. An intermediate-term target projects to the 92 area — detailed repeatedly — and is increasingly within view.
Conversely, initial support (84.50) is followed by the firmer breakout point (81.50). The 50-day moving average is rising toward support.
Elsewhere, the Utilities Select Sector SPDR (XLU) is not illustrated, though the group continues to outperform, as detailed May 24. (See this link for the group’s chart.)


