Bull trend persists, S&P 500 absorbs pullback from record highs
Focus: Gold takes flight amid inflation data, Emerging markets challenge key trendline, GLD, EEM, SPOT, H, COTY
U.S. stocks are higher early Friday, rising as bullish momentum persists despite a soft batch of economic data.
Against this backdrop, each big three U.S. benchmark seems to have absorbed a modest early-week pullback, fueled by selling pressure that inflicted limited true technical damage.
Editor’s Note: As always, updates can be directly accessed at chartingmarkets.substack.com.
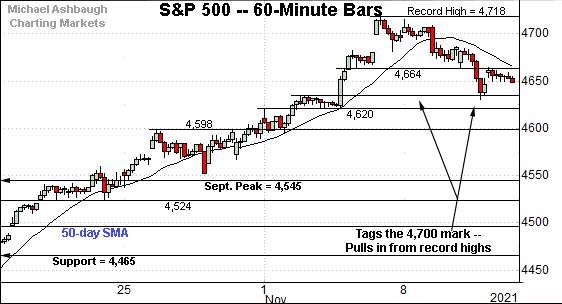
Before detailing the U.S. markets’ wider view, the S&P 500’s hourly chart highlights the past four weeks.
As illustrated, the S&P has pulled in from record highs.
Tactically, the 4,464 area remains an inflection point.
Thursday’s session high (4,464.5) registered nearby.
Delving deeper, the prevailing pullback has thus far been underpinned by the early-month breakout point (4,635).
Similarly, the Dow Jones Industrial Average has extended its pullback.
The prevailing downturn places its breakout point (35,892) within view.
Conversely, the 36,180 area pivots to near-term resistance.
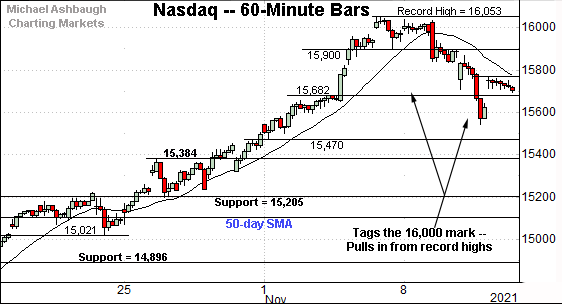
Against this backdrop, the Nasdaq Composite has also pulled in.
The downturn has thus far been underpinned by the early-November breakout point (15,682).
Conversely, the 15,768 and 15,900 areas mark overhead inflection points.
Widening the view to six months adds perspective.
On this wider view, the Nasdaq is digesting its decisive November breakout.
Against this backdrop, near-term support points are not so well-defined.
Tactically, breakout point — the 15,384-to-15,403 area — remains the first notable floor.
Looking elsewhere, the Dow Jones Industrial Average has also reversed from recent record highs.
A consolidation phase remains underway following the persistent rally off the October low.
Tactically, the November peak (36,892) is followed by the firmer breakout point (35,630). (Also see the hourly chart.)
Similarly, the S&P 500 is digesting an aggressive rally to record territory.
Recall the strong November start originates from trendline support roughly matching the breakout point (4,545).
The bigger picture
As detailed above, the major U.S. benchmarks are acting well technically.
On a headline basis, each big three benchmark has pulled in from all-time highs, pressured amid lukewarm selling pressure that has thus far inflicted limited damage.
Moving to the small-caps, the iShares Russell 2000 ETF is also consolidating a recent breakout.
To reiterate, its early-November spike marked a truly unusual two standard deviation breakout, encompassing six straight closes atop the 20-day volatility bands.
Against this backdrop, the “expected” consolidation phase is underway.
Tactically, the post-breakout low (236.31) is followed by the firmer breakout point (234.50).
Similarly, the SPDR S&P MidCap 400 ETF has sustained its recent break to record territory.
As detailed repeatedly, the November breakout punctuates a prolonged range, opening the path to potentially material longer-term gains.
Placing a finer point on the S&P 500, the index has pulled in modestly from recent record highs.
Tactically, the 4,664 area — detailed previously — marks an inflection point.
Thursday’s session high (4,464.5) registered nearby.
Delving deeper, the prevailing pullback has thus far been underpinned by the early-month breakout point (4,635).
More broadly, the S&P 500 has pulled in following an aggressive 3.4% technical breakout.
The prevailing pullback punctuates a single-session hesitation pattern — detailed Monday — at the November peak.
Against this backdrop, an overdue near-term consolidation phase remains underway.
But more importantly, the S&P 500’s backdrop supports a firmly-bullish bigger-picture bias.
Tactically, trendline support, circa 4,600, is followed by the more important breakout point (4,545). The prevailing bull trend is comfortably intact barring a violation.
Watch List
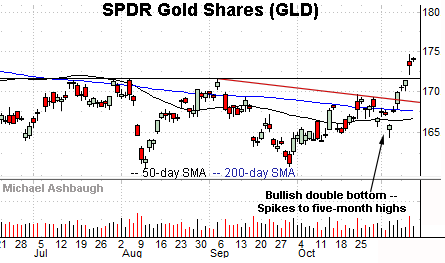
Drilling down further, the SPDR Gold Shares ETF has broken out.
Specifically, the shares have knifed to 20-month highs, rising amid heightened inflation concerns, following two separate price reports released this week.
The breakout punctuates a bullish double bottom defined by the August and September lows.
Though near-term extended, and due to consolidate, the nearly straightline November spike is longer-term bullish. Tactically, the breakout point (171.50) is followed by trendline support and the 200-day moving average.
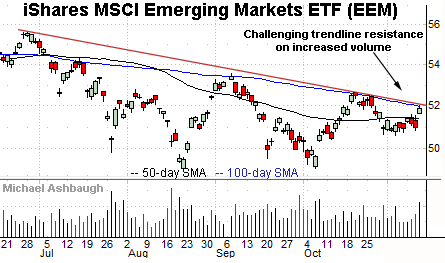
Elsewhere, the iShares MSCI Emerging Markets ETF is showing signs of life technically. (Yield = 1.5%.)
As illustrated, the shares are challenging trendline resistance closely matching the 100-day moving average, currently 51.97.
The prevailing upturn punctuates a tight November range — amid a volume spike — improving the chances of eventual follow-through.
Tactically, the 50-day moving average, currently 51.36, has marked an inflection point. A breakout attempt is in play barring a violation.
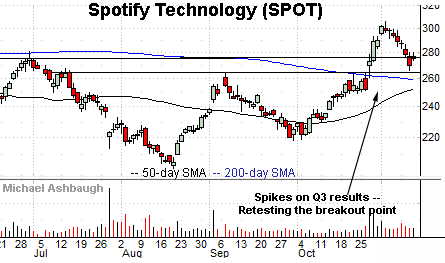
Initially profiled Oct. 29, Spotify Technology remains well positioned.
Late last month, the shares knifed to eight-month highs, rising after the company’s quarterly results.
The subsequent pullback places the shares near the breakout point (275.60) and 10.5% under the November peak.
Delving deeper, the former range top (263.60) is closely followed by the 200-day moving average. A sustained posture atop this area signals a bullish bias.
Hyatt Hotels Corp. is a well positioned large-cap name.
Late last week, the shares knifed to 20-month highs, rising after the company’s third-quarter results. (The November peak missed an all-time high by just six cents.)
The subsequent pullback places the shares near the breakout point (86.50) and 10.3% under the November peak.
Delving deeper, the ascending 50-day moving average roughly matches the former range bottom (81.60). A sustained posture higher signals a bullish bias.
More broadly, the shares are well positioned on the five-year chart, rising from a massive cup-and-handle defined by the 2020 and 2021 lows.
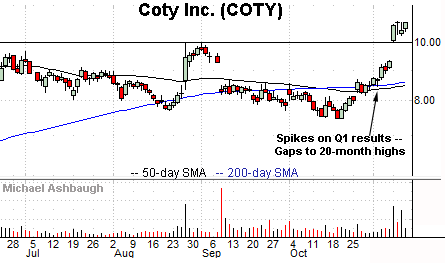
Coty, Inc. is a well positioned large-cap beaty and fragrance name.
Technically, the shares have recently gapped to 20-month highs, rising after the company’s first-quarter results.
The subsequent tight range signals muted selling pressure, positioning the shares to build on the initial spike. Tactically, the prevailing rally attempt is intact barring a violation of gap support (9.99).


