Bull trend broadens, S&P 500 challenges 200-day average
Focus: 10-year yield knifes toward technical target, Financials and Transports sustain recovery attempt
Technically speaking, U.S. stocks have extended a stealth rally attempt, rising sharply from the March low.
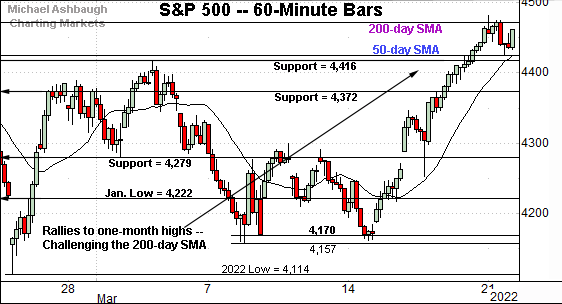
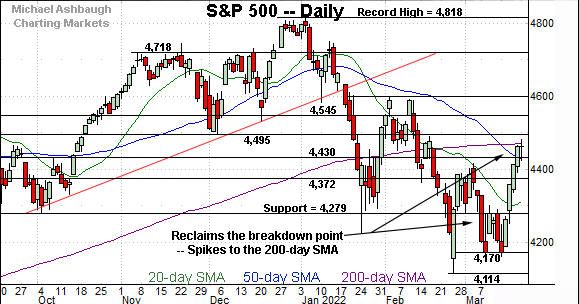
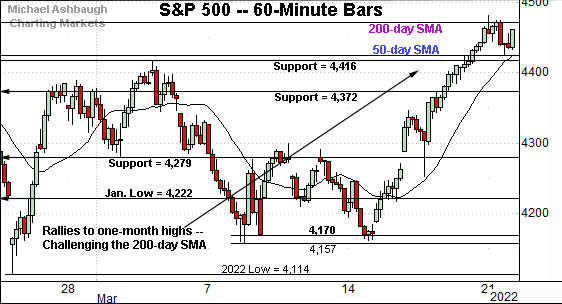
Against this backdrop, the S&P 500 has reached a potentially consequential test of its 200-day moving average, currently 4,473. The response to this area — potentially across the next several sessions — will likely add color.
Editor’s Note: As always, updates can be directly accessed at https://chartingmarkets.substack.com.
Before detailing the U.S. markets’ wider view, the S&P 500’s hourly chart highlights the past four weeks.
As illustrated, the S&P has extended its rally attempt, knifing to one-month highs.
In the process, the index is challenging its marquee 200-day moving average, currently 4,473. As always, the 200-day is a widely-tracked longer-term trending indicator.
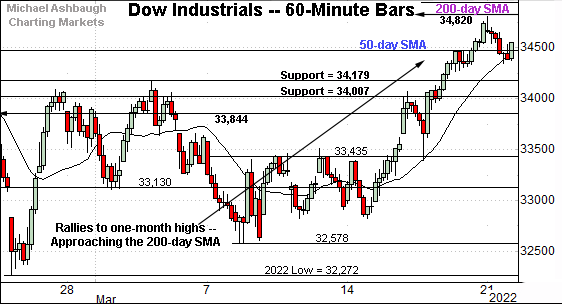
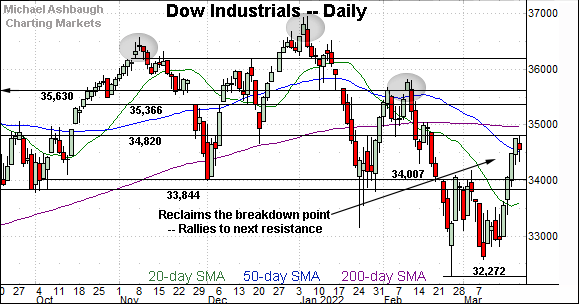
Similarly, the Dow Jones Industrial Average has tagged one-month highs.
Two overhead inflection points are within view:
Major resistance (34,820) an area better illustrated on the daily chart.
The slightly more distant 200-day moving average, currently 34,975.
Monday’s session high (34,808) registered slightly under resistance, and an extended retest remains underway.
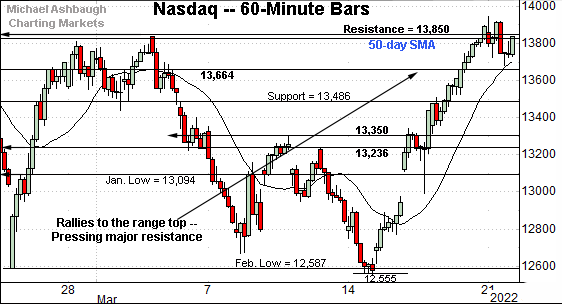
Against this backdrop, the Nasdaq Composite is challenging major resistance. Here again, two inflection points stand out:
Major resistance matching the breakdown point (13,850).
The 50-day moving average, currently 13,830.
Against this backdrop, Monday’s close (13,838) effectively matched resistance. The index has followed through firmly higher early Tuesday.
The prevailing upturn originates from 52-week lows.
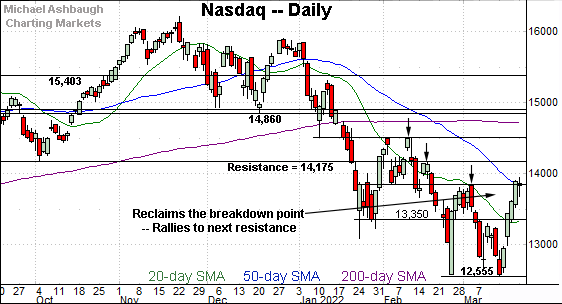
Widening the view to six months adds perspective.
On this wider view, the Nasdaq has knifed to major resistance.
To reiterate, the specific area matches the breakdown point (13,850) and the 50-day moving average, currently 13,830.
Tactically, sustained follow-through atop this area would mark a material “higher high” strengthening the bull case.
On further strength, major resistance (14,175) matches the late-2021 range bottom and is followed by the Feb. peak (14,509).
More broadly, the Nasdaq is rising from a 15-month closing low to punctuate a 21.6% pullback from its record close.
Looking elsewhere, the Dow Jones Industrial Average has extended its rally attempt.
The prevailing upturn places the index firmly atop its breakdown point (34,007), and slightly atop the 50-day moving average, currently 34,475.
Tactically, the Dow’s recovery attempt is intact barring a violation of the 34,000 area.
On further strength, major resistance (34,820) is followed by the marquee 200-day moving average, currently 34,975.
Recall the 200-day moving average marked a February inflection point. Sustained follow-through higher would signal a bullish-leaning longer-term bias.
Meanwhile, the S&P 500 has knifed sharply atop its breakdown point (4,279).
But interestingly, the prevailng spike has not yet marked a two standard deviation breakout, a function of recently wide-ranging market price action.
Tactically, an extended test of the 200-day moving average, currently 4,473, remains underway. Slightly more distant overhead matches the January breakdown point (4,495).
The bigger picture
As detailed above, the major U.S. benchmarks have extended a March rally attempt.
The relatively aggressive upturn places major resistance under siege — see Nasdaq 13,850, Dow 34,820 and the S&P 500’s 200-day moving average.
Against this backdrop, a more firmly-grounded near-term recovery attempt remains underway. The more important bigger-picture bias remains in flux, based on today’s backdrop, pending the response to resistance just detailed — particularly the S&P’s 200-day moving average.
(Each benchmark’s backdrop is different in key respects. The S&P 500’s backdrop is generally the most useful broad-market gauge.)
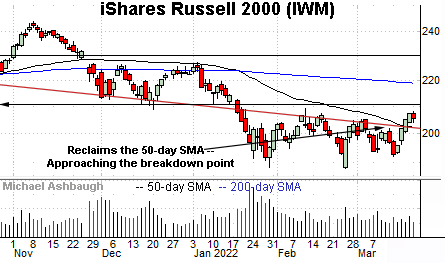
Moving to the small-caps, the iShares Russell 2000 ETF has also turned higher.
The prevailing upturn places it atop trendline resistance and the 50-day moving average, currently 201.96.
On further strength, the Feb. peak (209.05) is followed by the firmer breakdown point (211.10). Follow-through higher would strengthen the bull case.
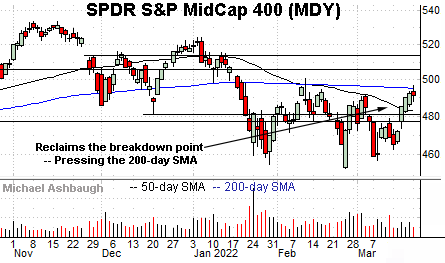
Meanwhile, the SPDR S&P MidCap 400 ETF remains comparably stronger than the Russell 2000.
Tactically, the MDY has reclaimed its breakdown point (477.50) — and the 50-day moving average — rising to challenge the 200-day moving average, currently 495.38.
Recall the 200-day capped the February rally attempt. The prevailing retest from underneath will likely add color.
Placing a finer point on the S&P 500, the index has tagged one-month highs.
Against this backdrop, the 50-day moving average, currently 4,424, is closely followed by the breakout point (4,416).
Tactically, this area pivots to support. A relatively swift violation would raise a question mark.
More broadly, the S&P 500 has knifed to its 200-day moving average, currently 4,473.
Slightly more distant overhead matches the January breakdown point (4,495).
So collectively, the S&P 500 has reached a potentially consequential technical test — the 4,475-to-4,495 area — amid a near-term extended posture.
The response to this area — potentially across the next several sessions — should be a useful bull-bear gauge.
As always, it’s not just what the markets do, it’s how they do it.
But generally speaking, sustained follow-through atop the 200-day moving average, and the former breakdown point (4,495) would signal a bullish-leaning longer-term bias.
Beyond specific levels, the prevailing rally attempt has registered constructive technical traits — including respectable market breadth — a backdrop detailed last week.
Editor’s Note: The next review will be published Thursday.
Watch List
Drilling down further, the 10-year Treasury note yield (TNX) continues to take flight.
In the process, the yield has knifed to 34-month highs, its highest level since May 2019.
Tactically, an intermediate-term target projects to the 2.42 area, detailed last week. The week-to-date peak (2.39) has registered nearby.
More broadly, the prevailing broad-market recovery attempt — despite surging yields — would seem to strengthen the bull case. Note carefully, a similar backdrop prevailed as the S&P 500 asserted its most recent major top. (See the Feb. 11 review, as the S&P 500 topped near major resistance.)
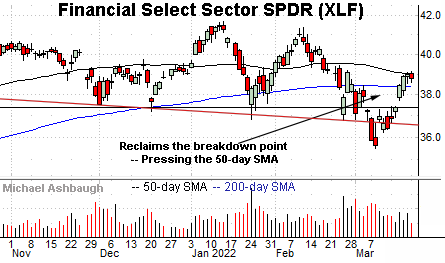
Moving to U.S. sectors, the Financial Select Sector SPDR (XLF) has extended its rally attempt, rising amid surging Treasury yields.
The prevailing upturn places the 50-day moving average, currently 38.95, under siege.
As detailed previously, the 50-day has marked a well-defined bull-bear inflection point. (See the December price action.) Sustained follow-through higher would strengthen the bull case.
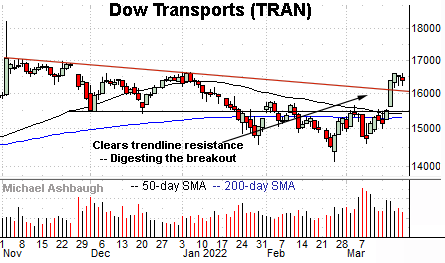
Finally, the Dow Transports (TRAN) are also acting well technically.
Earlier this month, the group knifed atop trendline resistance as well as the 50- and 200-day moving averages.
By comparison, the ensuing pullback has been flat, positioning the group to build on the March breakout. Tactically, the prevailing recovery attempt is intact baring a violation of the former breakdown point (15,490), an area closely followed by the major moving averages.
More broadly, the transports and financials are traditional U.S. sector leaders. The process of repairing extensive sub-sector damage seems to be underway.


