Market bulls resurface, U.S. benchmarks reclaim major resistance amid nascent rally attempt
Focus: Key U.S. sectors vie to repair technical damage, Pockets of sector strength persist, China's massive reversal from multi-year lows, TRAN, XLF, SMH, XLE, XOP, FXI
Technically speaking, U.S. stocks have extended a bullish reversal, rising sharply as the overhang of the Federal Reserve’s policy statement is removed.
Against this backdrop, each big three U.S. benchmark has reclaimed major resistance — around S&P 4,280, Nasdaq 13,350 and Dow 34,000 — rising amid respectable underlying breadth. A recovery attempt is underway, though sustainability and follow-through remain open questions.
Editor’s Note: As always, updates can be directly accessed at https://chartingmarkets.substack.com.
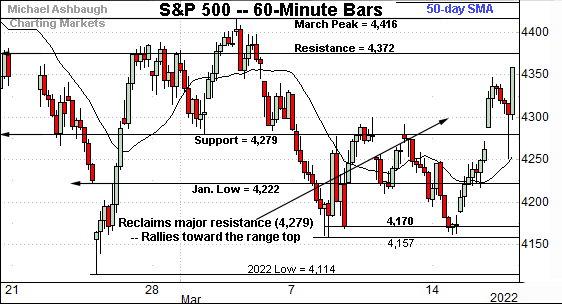
Before detailing the U.S. markets’ wider view, the S&P 500’s hourly chart highlights the past four weeks.
As illustrated, the S&P has reclaimed its breakdown point (4,279) extending a rally from the March low.
The prevailing upturn places major resistance (4,372) — detailed repeatedly — within view.
Thursday’s early session high (4,371.97) matched the inflection point.
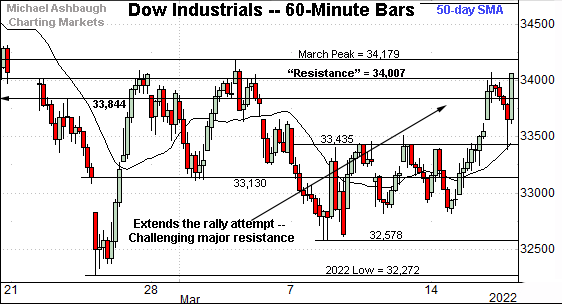
Similarly, the Dow Jones Industrial Average has extended its rally attempt.
Tactically, an extended retest of the breakdown point (34,007) remains underway, an area also detailed on the daily chart.
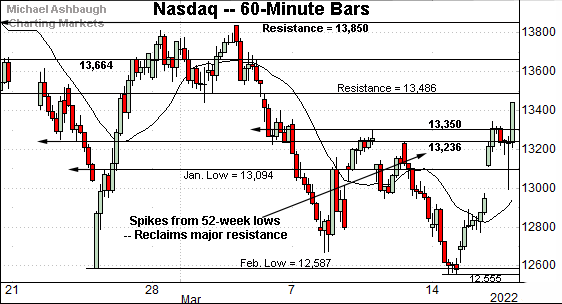
Against this backdrop, the Nasdaq Composite has knifed from 52-week lows.
The prevailing upturn places the index atop major resistance (13,350), an area it reclaimed during Wednesday’s final 15 minutes.
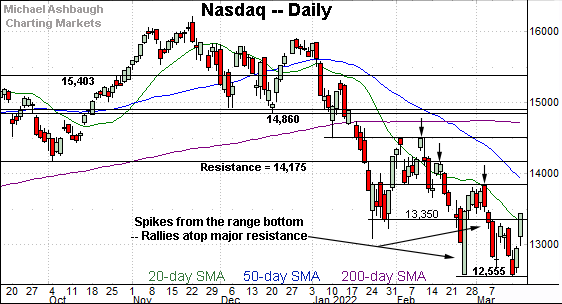
Widening the view to six months adds perspective.
On this wider view, the Nasdaq has reversed sharply from the March low.
In the process, the index has reclaimed major resistance (13,350), marking its first rally atop major resistance since January. (See the arrows, signaling recent failed tests of resistance.)
Tactically, a fragile recovery attempt is in play barring a closing violation of the 13,350 area.
On further strength, the 50-day moving average is descending toward firmer resistance at the breakdown point (13,850). Recall the March peak (13,837) registered just slightly under resistance.
The Nasdaq’s intermediate-term bias remains bearish pending follow-through atop the 13,850 area.
Beyond technical levels, the Nasdaq is rising from a 15-month closing low to punctuate a 21.6% pullback from its record close.
Looking elsewhere, the Dow Jones Industrial Average has knifed to its breakdown point (34,007), a familiar bull-bear fulcrum.
Wednesday’s close (34,063) registered slightly atop resistance, though an extended retest remains underway.
On further strength, the March peak (34,179) remains slightly more distant. (See the hourly chart.)
Tactically, a recovery attempt is in play barring a violation of the 34,000 area. The Dow’s more important intermediate- to longer-term bias remains bearish based on today’s backdrop.
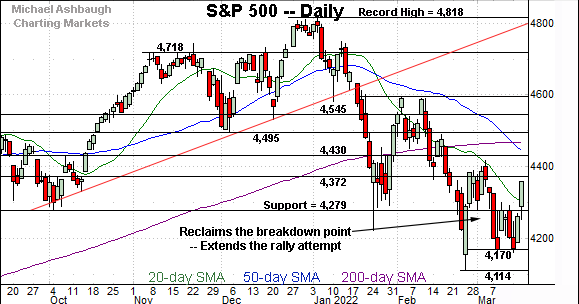
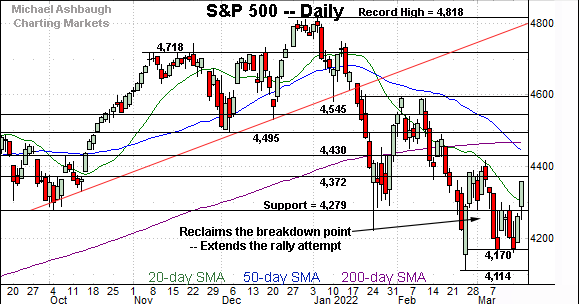
Meanwhile, the S&P 500 has reclaimed its breakdown point (4,279), a familiar bull-bear fulcrum.
The prevailing upturn punctuates a mini double bottom defined by the March closing lows (4,170).
The bigger picture
As detailed above, the major U.S. benchmarks have reversed respectably from the March low.
In the process, each index has reclaimed major resistance — around S&P 4,280, Nasdaq 13,350 and Dow 34,000.
Against this backdrop, a fragile near-term recovery attempt is underway, though within the context of a still bearish bigger-picture bias. The quality of the pending rally attempt — as measured by volume, breadth and price action — will likely add color.
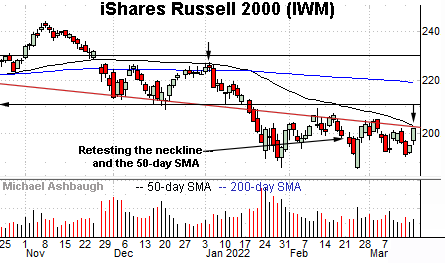
Moving to the small-caps, the iShares Russell 2000 ETF has strengthened slightly versus the major U.S. benchmarks.
Recall the small-cap benchmark is rising from a higher closing low, unlike the big three U.S. benchmarks.
Tactically, the 50-day moving average, currently 202.60, closely matches trendline resistance, and is followed by the March peak (205.30). Follow-through atop this area would mark technical progress.
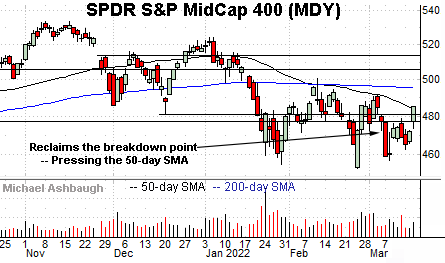
Meanwhile, the SPDR S&P MidCap 400 ETF has reclaimed its breakdown point (477.50).
From current levels, the descending 50-day moving average, currently 483.70, is followed by the March peak (491.18), and the flatlining 200-day moving average, currently 495.40.
Market breadth presses bullish extremes
Moving to market breadth, Wednesday’s Fed-fueled rally registered firmly-bullish internals, in spots.
For instance, advancing volume surpassed declining volume by a 5-to-1 margin on the NYSE, and a more impressive 8-to-1 margin on the Nasdaq.
As always, in a textbook world, two 9-to-1 rallies — across about a seven-session window — reliably signals a major trend shift. (The 2019 bull run started with two January 9-to-1 rallies across a precisely seven-session window.)
Against the current backdrop, the Nasdaq’s outsized strength may simply be a function of its previously deeply oversold posture. Time will tell whether bullish follow-through ultimately registers.
Returning to the S&P 500, the index has knifed firmly atop its breakdown point (4,279).
The prevailing upturn punctuates a small double bottom defined by the March closing lows — at 4,170 and 4,173.
So collectively, several developments stand out against the current backdrop:
The S&P 500 has knifed firmly atop major resistance (4,279).
The bullish reversal originates from well-defined support (4,170).
The March low marks a “higher low” versus the February low, a backdrop signaling waning bearish momentum.
The reversal has been fueled by 5-to-1 positive breadth. Though not textbook bullish, this marks a respectable reading in the post-pandemic market context.
On a negative note, the prevailing upturn follows a Federal Reserve policy statement, an event known for inducing sometimes spectacular, but frequently unsustainable, market moves.
Against this backdrop, the S&P 500’s near-term recovery attempt is intact barring a violation of the 4,280 area.
On further strength, more distant inflection points match the March peak (4,416) and the 50- and 200-day moving averages. The S&P 500’s intermediate- to longer-term bias remains bearish pending sustained follow-through atop this area.
Watch List — U.S. sectors vie to repair technical damage
Drilling down further, the process of repairing extensive U.S. sub-sector damage may be underway. Several groups exemplify the prevailing backdrop:
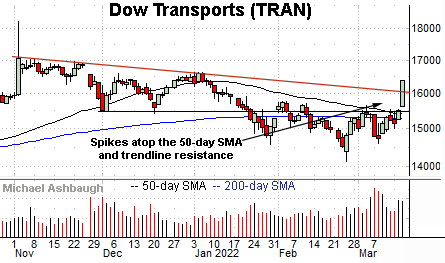
To start, the Dow Transports (TRAN) have come to life, rising at least partly amid easing energy prices.
In the process, the group has knifed atop trendline resistance as well as the 50- and 200-day moving averages. The decisive breakout signals a trend shift.
Tactically, the prevailing recovery attempt is intact baring a violation of the former breakdown point (15,490), an area closely followed by the major moving averages.
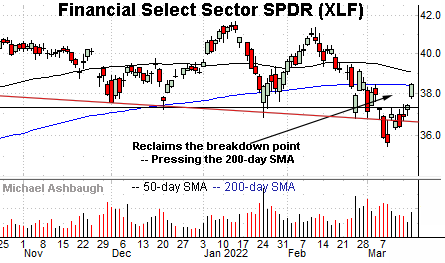
Meanwhile, the Financial Select Sector SPDR (XLF) has also come to life, rising as the Federal Reserve’s tightening cycle formally begins.
In the process, the group has reclaimed its breakdown point (37.20), an area that pivots to support.
More immediately, the marquee 200-day moving average, currently 28.41, is under siege.
As always, the 200-day moving average is a widely-tracked longer-term trending indicator. The pending retest from underneath should be a useful bull-bear gauge. (Wednesday’s close registered within two cents.)
On further strength, the 50-day moving average, currently 39.02, remains slightly more distant. Sustained follow-through atop the 50-day would strengthen the bull case. (See the December price action.)
Looking elsewhere, the VanEck Vectors Semiconductor ETF (SMH) has rallied less aggressively from the March low.
Nonetheless, the group has reclaimed its breakdown point (257.00) an area that pivots to support. A recovery attempt is in play barring a violation.
On further strength, trendline resistance is followed by the 200-day moving average, a recent bull-bear inflection point. The group’s longer-term bias remains bearish pending follow-through atop this area.
More broadly, notice the pending death cross — or bearish 50-day/200-day moving average crossover — an event that will likely signal this week.
Pockets of sector strength persist
Looking elsewhere, familiar pockets of sector strength are intact. Two groups exemplify the backdrop:
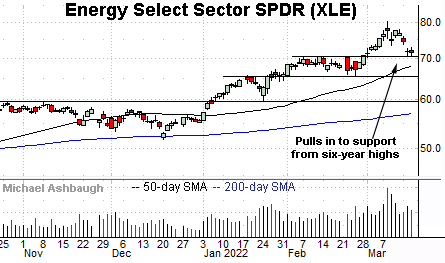
To start, the Energy Select Sector SPDR (XLE) is acting well technically. (Yield = 3.9%.)
Earlier this month, the group briefly tagged six-year highs, rising from a tight February range.
The subsequent pullback has been underpinned by the breakout point (70.50) placing the group 10.9% under the March peak. Delving deeper, the ascending 50-day moving average is followed by the former range bottom (65.50).
Similary, the SPDR S&P Oil & Gas Exploration ETF (XOP) is technically well positioned. (Yield = 1.4%.)
Tactically, the prevailing pullback places the group near the breakout point (114.00) and 10.2% under the March peak.
Delving deeper, the 50-day moving average has marked an inflection point and is rising toward support.
China’s massive reversal from 13-year lows
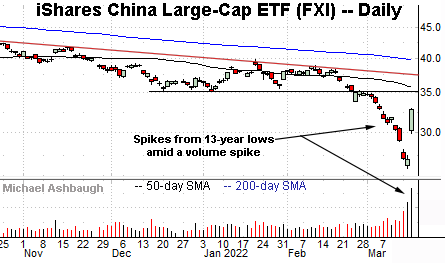
Finally, the iShares China Large-Cap ETF (FXI) — profiled Tuesday — has staged a massive reversal from 13-year lows.
Wednesday’s 21.2% spike marked its biggest single-day gain on record.
Tactically, the top of the gap (29.86) pivots to support.
Conversely, the breakdown point (35.25) marks major resistance, an area toward which the 50-day moving average is descending. The FXI’s intermediate-term bias remains bearish pending follow-through atop this area.


