Bearish momentum accelerates, S&P 500 ventures under major support
Focus: Nasdaq violates its breakout point, Russell 2000 extends under 200-day moving average
U.S. stocks are firmly lower early Monday, pressured amid concerns over potential contagion after a Chinese real estate company’s debt default.
Against this backdrop, potentially consequential technical tests are currently underway. The S&P 500 has ventured Monday under major support — the 4,370 area — while the Nasdaq Composite is challenging an important floor closely matching the 50-day moving average.
Editor’s Note: As always, updates can be directly accessed at chartingmarkets.substack.com.
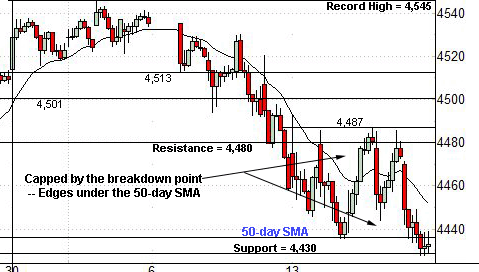
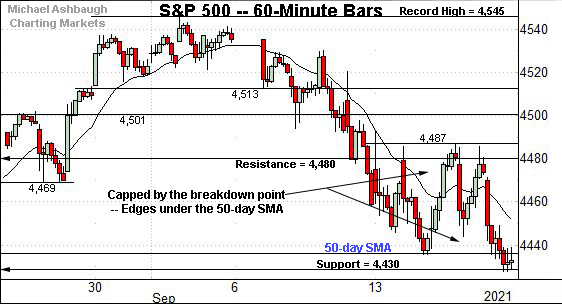
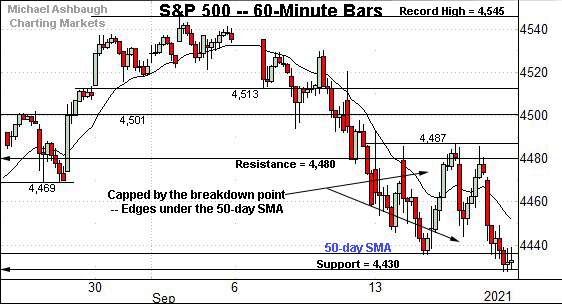
Before detailing the U.S. markets’ wider view, the S&P 500’s hourly chart highlights the past four weeks.
As illustrated, the S&P has failed its latest test of the breakdown point (4,480) from underneath.
Moreover, last week’s close (4,433) registered slightly under the 50-day moving average, currently 4,436.
The S&P has extended its September downturn with Monday’s firmly lower start.
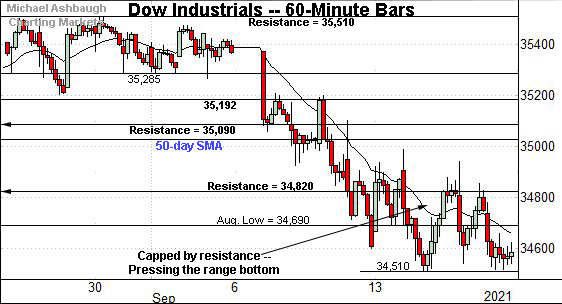
Similarly, the Dow Jones Industrial Average has asserted a lower plateau.
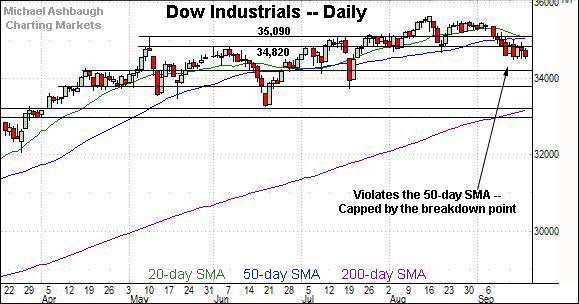
Here again, recent rally attempts have been capped by familiar resistance (34,820), an area also detailed on the daily chart.
Slightly more broadly, the prevailing range is a bearish continuation pattern, punctuated by Monday’s early downside follow-through.
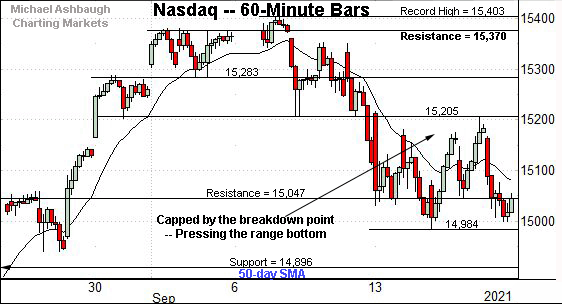
Against this backdrop, the Nasdaq Composite remains comparably stronger than the other benchmarks.
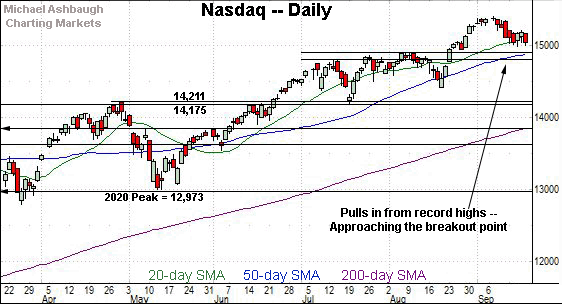
Still, the index has drawn selling pressure near its breakdown point (15,205). Bearish near-term price action.
Monday’s early downturn places major support — including the 50-day moving average, currently 14,877 — under siege.
(On a granular note, last week’s close (15,043) effectively matched resistance (15,047) and the Nasdaq has subsequently extended its downturn. Shaky price action.)
Widening the view to six months adds perspective.
On this wider view, the Nasdaq’s September downturn initially paused near the 15,000 mark, an area also detailed on the hourly chart.
More immediately, the index is challenging its first significant support early Monday.
The specific area matches the 50-day moving average, currently 14,877, and the breakout point (14,896).
Delving slightly deeper, the early-July range top (14,803) remains an inflection point.
Tactically, a closing violation of the 14,800 area, and the 50-day moving average, would raise a technical question mark.
Looking elsewhere, the Dow industrials asserted a bearish intermediate-term bias on Sept. 10.
The index has since sustained a posture comfortably under its 50-day moving average, currently 35,032.
Separately, the Dow has also struggled to reclaim its former range top (34,820), an area defining a breakdown point of sorts.
On further weakness, the 34,200 area is followed by the July closing low (33,962) and the absolute July low (33,741).
Beyond specific levels, the Dow industrials’ intermediate-term bias remains bearish pending technical repairs. An eventual rally atop the 34,820 area would mark a step toward stabilization.
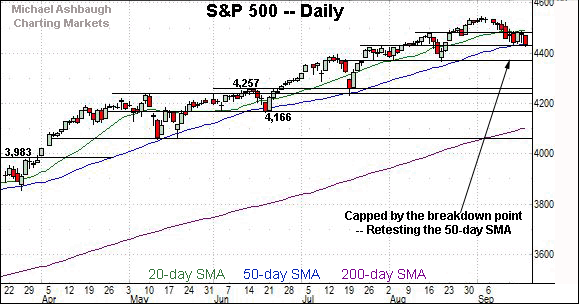
Meanwhile, the S&P 500 asserted a lower plateau last week.
Tactically, the breakdown point (4,480) — detailed repeatedly — effectively defines the range top.
More immediately, the 50-day moving average, currently 4,436, is closely followed by the 4,430 support.
Last week’s close (4,433) matched support, and the S&P has ventured firmly lower early Monday.
The bigger picture
As detailed above, the U.S. benchmarks’ September downturn continues to inflict damage.
Against this backdrop, the Dow Jones Industrial Average has tagged two-month lows early Monday, building on a mid-month violation of its 50-day moving average.
Meanwhile, the S&P 500 has ventured under major support (4,430) early Monday as it vies to avoid notching consecutive closes under its 50-day moving average for the first time since November.
Elsewhere, the Nasdaq Composite remains comparably stronger than the other benchmarks. But here again, the index has ventured under major support (14,896) early Monday, an area roughly matching the 50-day moving average, currently 14,877.
So collectively, potentially consequential technical tests are currently underway. Monday’s session close, and the next several sessions, will likely add color.
Moving to the small-caps, the iShares Russell 2000 ETF has extended a pullback from the range top.
In the process, the small-cap benchmark has ventured early Monday under its 200-day moving average, currently 218.83.
Tactically, deeper support, circa 215.40, is followed by the August low (210.68).
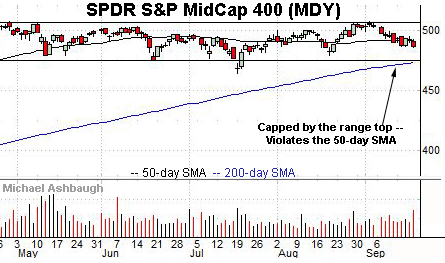
Similarly, the SPDR S&P MidCap 400 ETF has extended its September downturn.
Tactically, the prevailing range bottom, circa 475.10, is followed by the 200-day moving average, currently 473.54.
Placing a finer point on the S&P 500, the index has failed the latest test of its breakdown point (4,480), an area detailed repeatedly.
More immediately, the S&P has ventured early Monday under its 50-day moving average, currently 4,436, and the 4,430 support.
Returning to the six-month view, the S&P 500 is vying Monday to avoid notching consecutive closes under its 50-day moving average for the first time since early November. (Since just before the U.S. election.)
Delving deeper, likely last-ditch support matches the S&P’s former range bottom (4,372) and the August low (4,367).
Against this backdrop, Monday’s early session low (4,356) has registered under major support, though it’s the session close that matters.
Tactically, an eventual violation of the 4,370 area would mark a material “lower low” — combined with a violation of the 50-day moving average — likely raising an intermediate-term caution flag.
As always, it’s not just what the markets do, it’s how they do it.
The S&P 500’s response to major support — across potentially the next several sessions — will likely add color. No new setups today.

