Charting a bull-trend pullback, S&P 500 retests the breakout point (4,480)
Focus: Nasdaq 100 sustains break to record territory, QQQ, AMBA, SMTC, SPLK, STLD
U.S. stocks are lower early Friday, pressured amid renewed virus concerns and following an inflation report signaling the sharpest monthly increase in wholesale prices since 2010.
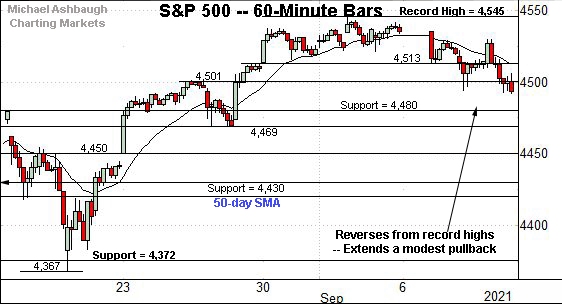
Against this backdrop, the S&P 500 has extended a downturn from recent record highs, pulling in to test its first notable floor at the breakout point (4,480).
Editor’s Note: As always, updates can be directly accessed at chartingmarkets.substack.com.
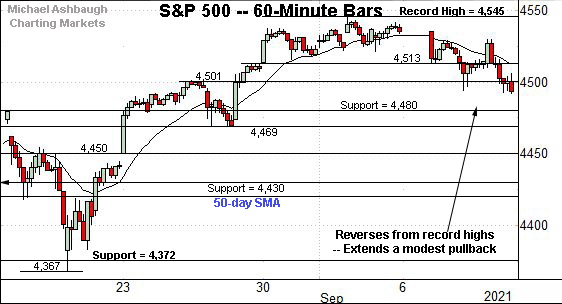
Before detailing the U.S. markets’ wider view, the S&P 500’s hourly chart highlights the past four weeks.
As illustrated, the S&P has extended a thus far modest pullback from record highs.
Tactically, the breakout point (4,480) marks the S&P’s first notable floor, and is followed by the post-breakout low (4,469).
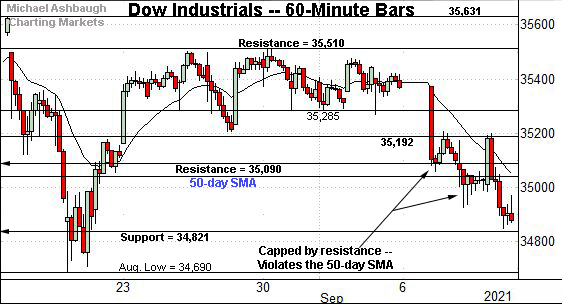
Meanwhile, the Dow Jones Industrial Average continues to diverge from the other benchmarks.
In the process, the index has violated its 50-day moving average, currently 35,040.
The prevailing downturn punctuates failed tests of resistance (35,192) across consecutive sessions. Bearish price action.
On further weakness, the 34,820 area is followed by the August low (34,690).
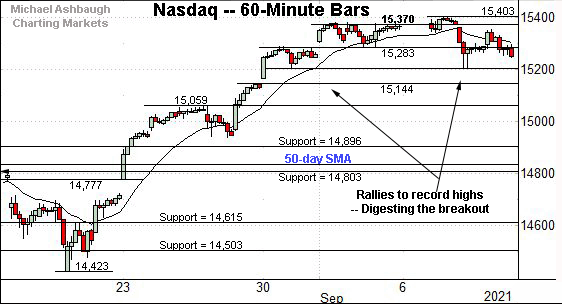
Against this backdrop, the Nasdaq Composite continues to outperform.
Recall the index has reached its near-term target of 15,370 detailed repeatedly. (See the Aug. 23 review, and subsequent reviews.)
The Nasdaq’s record close (15,374) has registered nearby.
Still, the selling pressure near record highs remains relatively muted — at least so far.
From current levels, the September low (15,206) is followed by familiar gap support (15,144).
Widening the view to six months adds perspective.
On this wider view, the Nasdaq is digesting an aggressive technical breakout.
To reiterate, the late-August rally marked a two standard deviation breakout, encompassing consecutive closes atop the 20-day Bollinger bands.
As always, a two standard deviation breakout signals a tension between time horizons.
Namely, the index is near-term extended, and due to consolidate, following a rally outside the normal range of its trailing 20-day volatility.
Still, the sharp rally signals extreme bullish momentum, likely laying the groundwork for longer-term follow-through.
Tactically, the Nasdaq’s breakout point (14,896) marks its first notable floor. The 50-day moving average, currently 14,828, is rising toward support.
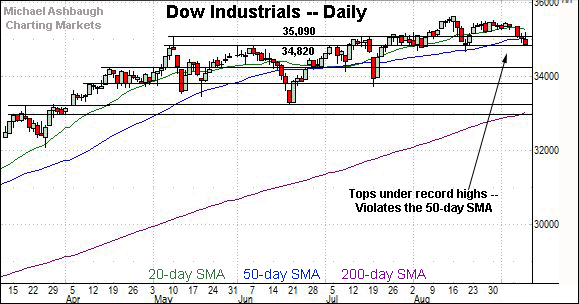
Looking elsewhere, the Dow Jones Industrial Average continues to lag behind.
As illustrated, the index has violated its 50-day moving average, currently 35,040, closing lower for the first time since July. (The Dow has not registered consecutive closes under the 50-day since June.)
Delving deeper, the former range top (34,820) is followed by a key inflection point matching the August low (34,690).
Tactically, a violation of the August low would mark a material “lower low” — combined with a violation of the 50-day moving average — raising a technical caution flag.
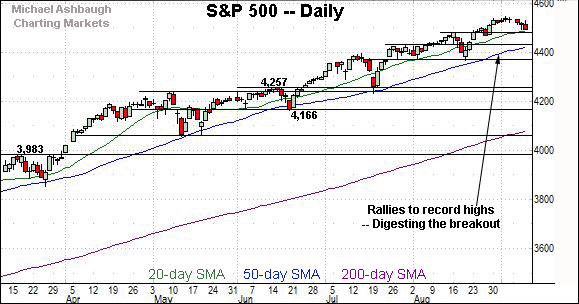
Meanwhile, the S&P 500 continues to digest its latest rally to record territory.
As detailed previously, the breakout point (4,480) marks the S&P’s first notable floor.
Friday’s early session low (4,480.06) matched support amid a retest that remains underway.
The bigger picture
As detailed above, the major U.S. benchmarks have diverged in recent weeks amid a backdrop that is increasingly not one-size-fits-all.
On a headline basis, the S&P 500 and Nasdaq Composite remain relatively resilient, staging thus far garden-variety pullbacks from recent record highs. Each benchmark’s intermediate-term bias remains comfortably bullish.
Meanwhile, the Dow Jones Industrial Average has placed distance under its 50-day moving average early Friday, pulling within view of key support matching the August low (34,690). (See the daily chart.)
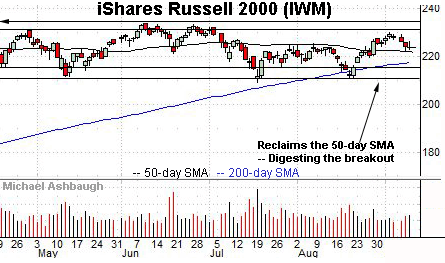
Moving to the small-caps, the iShares Russell 2000 ETF remains range-bound.
Within the range, the 50-day moving average, currently 221.80, marks an inflection point.
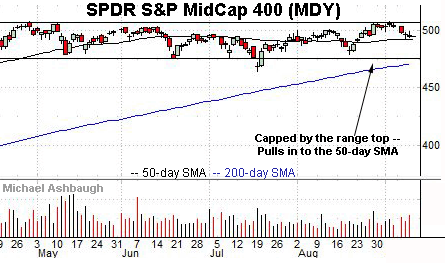
Similarly, the SPDR S&P MidCap 400 ETF is traversing a painfully familiar range.
Here again, the 50-day moving average bisects the range, and remains an inflection point.
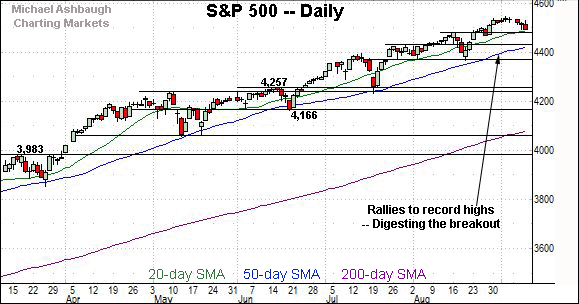
Placing a finer point on the S&P 500, the index has extended a thus far orderly pullback from record highs.
To reiterate, the breakout point (4,480) marks the S&P’s first notable floor.
Friday’s early session low (4,480.06) precisely matched support. The response to this area, and the weekly close, will likely add color.
More broadly, the S&P 500’s intermediate-term uptrend is firmly intact. The chart above moves from the lower left to the upper right.
Based on today’s backdrop, the breakout point (4,480) is followed by the S&P’s former range top (4,430).
Delving deeper, the 50-day moving average, currently 4,424, is followed by major support (4,372) closely matching the August low. (Recall prior retests of the 50-day moving average have been punctuated by bullish reversals, and a resumption of the uptrend.)
Tactically, an eventual violation of this area would mark a material “lower low” — combined with a violation of the 50-day moving average — raising a technical caution flag.
As always, it’s not just what the markets do, it’s how they do it. But generally speaking, the S&P 500’s intermediate-term bias remains bullish barring a violation of the 4,370 area.
Watch List
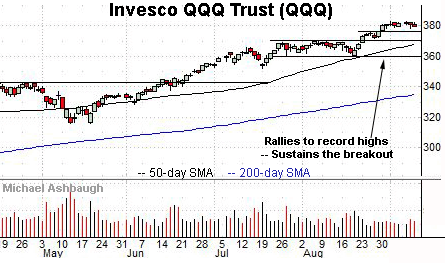
Drilling down further, the Invesco QQQ Trust is acting well technically. The QQQ tracks the Nasdaq 100 Index.
Late last month, the shares staged a bull-flag breakout, rising to record highs. (The tight late-August range defined the bull flag.)
Tactically, the breakout point (375.40) marks first support.
Delving deeper, the 50-day moving average, currently 367.95, is rising toward the former range top (369.90). The prevailing uptrend is intact barring a violation.
More broadly, the chart above exemplifies a narrowing broad-market rally, increasingly reliant on select large-cap technology names.
Combined, Apple, Microsoft, Alphabet, Facebook and Amazon account for about 24% of the S&P 500.
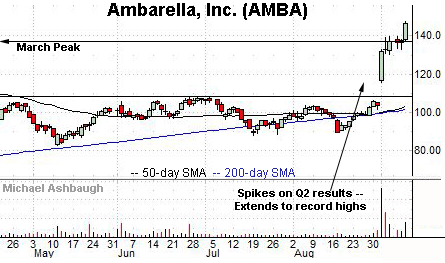
Ambarella, Inc. is a large-cap developer of semiconductor solutions for high-definition (HD) and image-processing applications.
Earlier this month, the shares gapped sharply higher, rising after the company’s quarterly results. The subsequent follow-through places the shares at record highs.
Though near-term extended, and due to consolidate, the sustained strong-volume rally likely lays the groundwork for longer-term gains. Tactically, a sustained posture atop the March peak (137.20) signals a comfortably bullish bias.
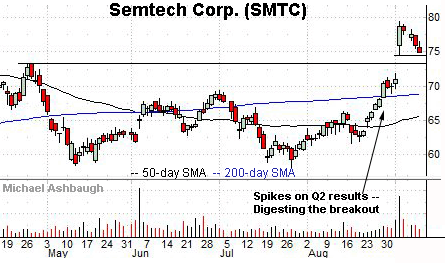
Semtech Corp. is a well positioned mid-cap semiconductor name.
Technically, the shares have recently gapped to six-month highs, rising after the company’s strong second-quarter results.
The subsequent pullback has been fueled by decreased volume, placing the shares near gap support (74.54) and 6.1% under the September peak.
Delving deeper, the former range top (73.35) is followed by the bottom of the gap (71.80). The prevailing rally attempt is intact barring a violation.
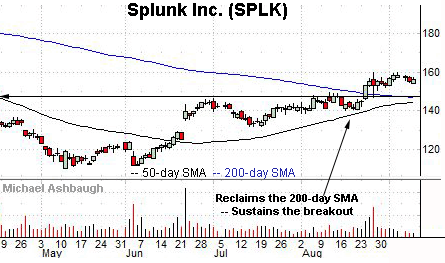
Splunk, Inc. is a large-cap developer of software and cloud solutions.
Late last month, the shares knifed to six-month highs, rising after the company’s quarterly results. The subsequent tight range signals muted selling pressure, positioning the shares to build on the strong-volume spike.
Tactically, the 200-day moving average closely matches the breakout point (147.60). A sustained posture higher signals a bullish bias.
Also notice the pending golden cross — or bullish 50-day/200-day moving average crossover — an event signaling that the intermediate-term uptrend has overtaken the longer-term trend.
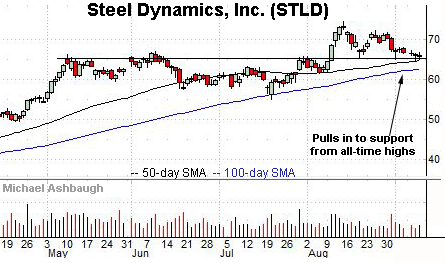
Finally, Steel Dynamics, Inc. is a well positioned large-cap steel producer. (Yield = 1.6%.)
The shares initially spiked four weeks ago, rising amid optimism over the prospects for an aggressive U.S. infrastructure bill.
The subsequent pullback places the shares near the breakout point (64.65) and 12.8% under the August peak.
Tactically, the 50-day moving average, currently 64.80, has marked a bull-bear inflection point and closely matches support. The prevailing rally attempt is intact barring a violation of this area.


