Charting a market divergence, U.S. benchmarks extend September pullback
Focus: Semiconductor sector challenges record highs, SMH, ON, AVGO, LULU, SPOT
U.S. stocks are mixed early Monday, vacillating in the wake of the U.S. benchmarks’ worst weekly performance since June.
Against this backdrop, the Dow Jones Industrial Average has registered consecutive closes under its 50-day moving average — amid shaky price action — while the S&P 500 and Nasdaq Composite remain comparably resilient.
Editor’s Note: As always, updates can be directly accessed at chartingmarkets.substack.com.
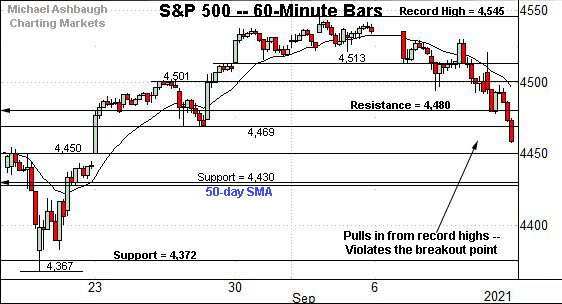
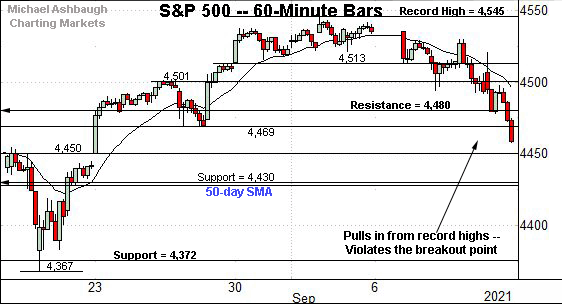
Before detailing the U.S. markets’ wider view, the S&P 500’s hourly chart highlights the past four weeks.
As illustrated, the S&P has extended its September pullback.
Tactically, the former breakout point (4,480) pivots to resistance.
Conversely, gap support (4,450) is followed by the 4,430 support. The 50-day moving average, currently 4,427, closely matches the latter.
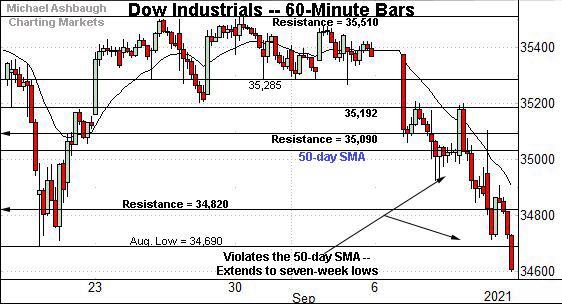
Meanwhile, the Dow Jones Industrial Average remains the weakest major benchmark.
As illustrated, the index has tagged seven-week lows, placing distance comfortably under the 50-day moving average.
Tactically, the August low (34,690) is followed by the Dow’s former range top (34,820), an area also detailed on the daily chart.
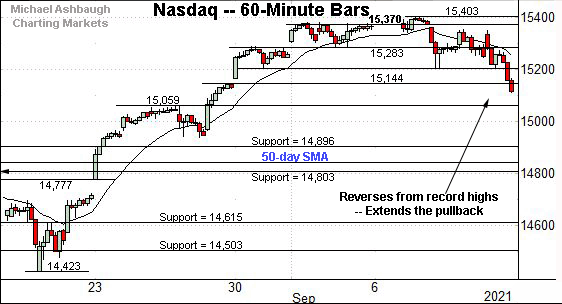
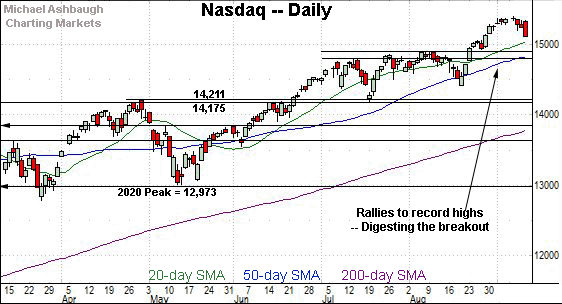
Against this backdrop, the Nasdaq Composite remains the strongest benchmark.
Nonetheless, the index has extended its September downturn, tagging two-week lows.
Tactically, the early-August peak (14,896) marks the Nasdaq’s first notable floor.
Widening the view to six months adds perspective.
On this wider view, the Nasdaq continues to consolidate its steep August breakout.
To reiterate, the breakout point — the early-August peak (14,896) — marks its first notable floor. The 50-day moving average, currently 14,837, is rising toward support.
Tactically, a sustained posture atop this area signals a bullish intermediate-term bias.
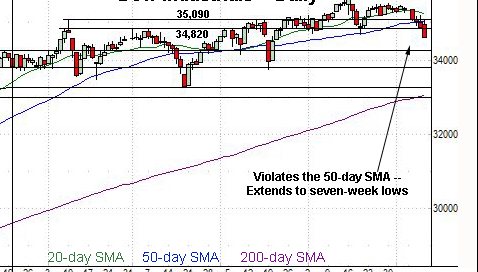
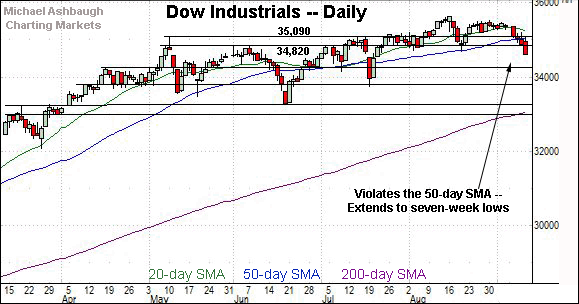
Looking elsewhere, the Dow Jones Industrial Average has diverged from the other benchmarks.
As illustrated, the index has tagged nearly two-month lows — its worst levels since July 21 — placing distance under the 50-day moving average, currently 35,041.
Moreover, the index has registered a material “lower low” vs. the August low (34,690).
The downturn raises the flag to a potential intermediate-term trend shift.
Tactically, notable overhead broadly spans from about 34,820 to 35,040. A swift reversal atop this area would place the index on firmer technical ground.
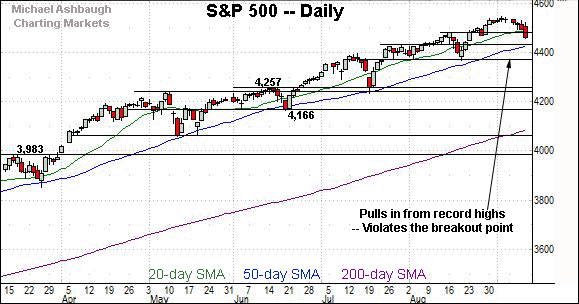
Meanwhile, the S&P 500 has registered a less-damaging September downturn — at least so far.
Still, selling pressure accelerated to conclude last week, placing the S&P under its breakout point (4,480).
Delving deeper, the 50-day moving average, currently 4,427, closely matches the 4,430 support.
The bigger picture
As detailed above, the major U.S. benchmarks continue to diverge.
On a headline basis, the Dow Jones Industrial Average has tagged seven-week lows, placing distance under its 50-day moving average. The downturn raises the flag to a potential intermediate-term trend shift.
Meanwhile, the S&P 500 and Nasdaq Composite continue to outperform.
Still, each benchmark has extended its September pullback from recent record highs. Though the technical damage has thus far been limited, in the broad sweep, the prevailing downturn is worth tracking for potential acceleration.
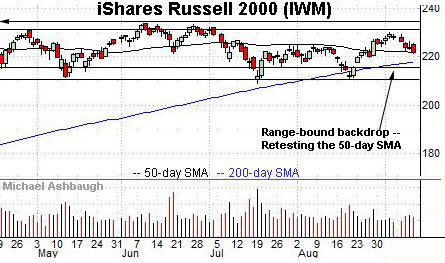
Moving to the small-caps, the iShares Russell 2000 ETF is traversing a familiar range.
Within the range, its latest retest of the 50-day moving average, currently 221.58, remains underway.
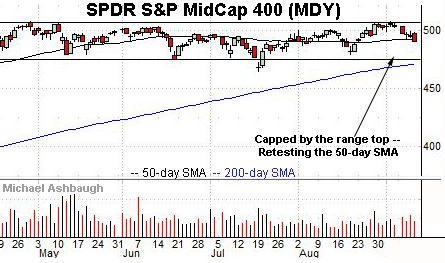
Similarly, the SPDR S&P MidCap 400 ETF remains range bound.
Here again, the 50-day moving average, currently 491.95, has marked an inflection point. A mid-September retest remains in play.
Placing a finer point on the S&P 500, the index has extended its September pullback.
Tactically, the former breakout point (4,480) pivots to resistance.
More broadly, the S&P 500 has reached a less-charted patch amid the September downturn.
Tactically, the 50-day moving average, currently 4,427, closely matches the S&P’s former range top (4,430).
Recall prior retests of the 50-day moving average have been punctuated by bullish reversals, and a resumption of the uptrend. (The S&P has not registered consecutive closes under the 50-day since early November.)
Delving deeper, the former range bottom (4,372) closely matches the August low (4,367). This area marks important support.
Tactically, an eventual violation of the 4,370 area would mark a material “lower low” — combined with a violation of the 50-day moving average — raising a technical caution flag.
Broadly speaking, the S&P 500’s intermediate-term bias remains bullish barring a violation of this area.
Watch List
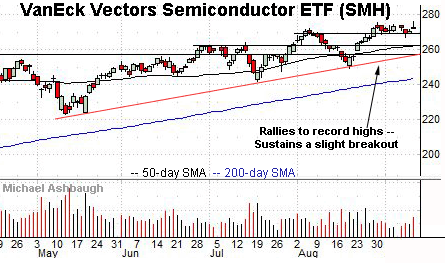
Drilling down further, the VanEck Vectors Semiconductor ETF continues to act well technically.
Late last month, the group rallied to record highs, edging atop resistance matching the early-August peak. The subsequent tight range signals muted selling pressure, positioning the group to extend its uptrend.
Tactically, the prevailing range bottom (269.10) is followed by the former range top (266.00). Trendline support is rising toward the latter.
Moving to specific names, ON Semiconductor Corp. — profiled Aug. 30 — has broken out.
The shares initially spiked six weeks ago, gapping higher after the company’s quarterly results.
More immediately, the shares have reached record highs, breaking out after a company insider disclosed a material stock purchase. The prevailing upturn punctuates a tight September range amid increased volume.
Tactically, an intermediate-term target continues to project to the 50.50 area. Conversely, the breakout point (45.70) pivots to support.
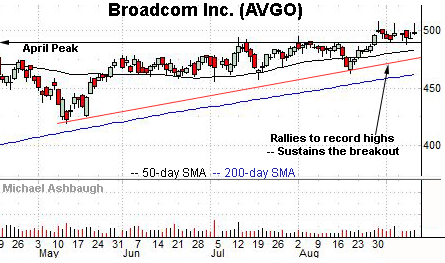
Broadcom, Inc. is well positioned large-cap semiconductor name. (Yield = 2.9%.)
Late last month, the shares reached record territory, clearing a well-defined five-month range top.
The subsequent flag-like pattern — the tight September range — positions the shares to build on the late-August rally. Tactically, trendline support is rising toward the breakout point (489.00).
More broadly, the shares are well positioned on the five-year chart, rising from a continuation pattern hinged to the massive 2020 rally.
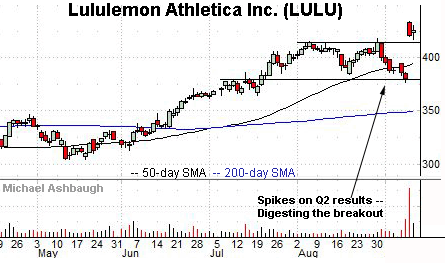
Lululemon Athletica, Inc. is a large-cap Vancouver-based athletic apparel retailer.
As illustrated, the shares have recently knifed to record territory, gapping sharply higher after the company’s second-quarter results.
By comparison, the immediate pullback has been flat, fueled by decreased volume.
Tactically, the post-breakout low (417.10) is closely followed by the breakout point (414.50). A sustained posture higher signals a firmly-bullish bias.
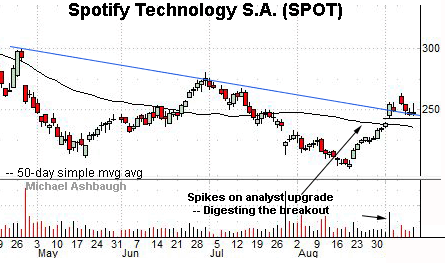
Finally, Spotify Technology is a large-cap Luxembourg-based developer of audio-streaming services.
Earlier this month, the shares gapped atop trendline resistance, rising after an analyst upgrade. The breakout signals a trend shift.
More immediately, the prevailing pullback places the shares 6.4% under the September peak.
Tactically, gap support (243.00) is followed by the 50-day moving average, currently 235.15. The recovery attempt is intact barring a violation.

