Charting a bullish reversal: U.S. benchmarks reclaim key levels
Focus: 10-year yield tags key technical levels, Semiconductors continue to outperform, TNX, SMH, AMAT, PFE, LOW, ON
U.S. stocks are mixed mid-day Wednesday, vacillating as a pronounced market volatility spike fades.
Against this backdrop, each big three U.S. benchmark has reversed sharply from the December low, rising to reclaim important technical levels. The prevailing rally attempt’s sustainability remains an open question.
Editor’s Note: As always, updates can be directly accessed at chartingmarkets.substack.com.
Before detailing the U.S. markets’ wider view, the S&P 500’s hourly chart highlights the past four weeks.
As illustrated, the S&P has spiked from the December low.
The bullish reversal punctuates a jagged test of major support (4,545) an important bull-bear fulcrum detailed repeatedly.
From current levels, the former range top (4,673) is closely followed by last month’s gap (4,664).
Similarly, the Dow Jones Industrial Average has spiked from a key technical level.
In its case, the index has knifed from its 200-day moving average, currently 34,450, to punctuate a jagged retest.
The bullish reversal places the Dow slightly atop major support (35,630) an area better illustrated on the daily chart.
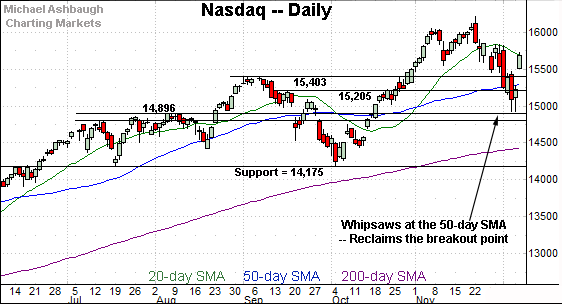
Against this backdrop, the Nasdaq Composite has also knifed from the December low.
The prevailing upturn places it back atop the breakout point — the 15,400 area — better illustrated below.
Widening the view to six months adds perspective.
On this wider view, the Nasdaq has reversed sharply from the December low.
The bullish reversal places it back atop the breakout point (15,403), a key bull-bear fulcrum, detailed repeatedly.
Based on today’s backdrop, the top of the gap (15,507) is followed by the former breakout point (15,403). A sustained posture higher signals a bullish intermediate-term bias.
Delving slightly deeper, the 50-day moving average, currently 15,318, is rising toward major support.
Looking elsewhere, the Dow Jones Industrial Average has knifed from the 34,000 mark.
The prevailing upturn punctuates a jagged test of the 200-day moving average. (The Dow registered a lone close under the 200-day, its first since July 2020.)
More immediately, the bullish reversal places it narrowly back atop its former breakout point (35,630).
Delving deeper, the 50-day moving average, currently 35,340, is followed by the former range top (35,090). A sustained posture atop this area signals a bullish-leaning intermediate-term bias.
Meanwhile, the S&P 500 has recently outperformed the other major benchmarks.
As illustrated, the index has weathered a jagged test of its breakout point (4,545), a level closely matching the 50-day moving average.
By comparison, the Dow industrials and Nasdaq Composite ventured more firmly under their corresponding inflection points, albeit briefly.
The bigger picture
As detailed above, the major U.S. benchmarks have knifed from the December low, reclaiming important technical levels.
In the process, the Nasdaq Composite and Dow industrials have rallied back atop their breakout points — the Nasdaq 15,400 and Dow 35,630 areas — reaching firmer technical ground.
Meanwhile, the S&P 500 remained comparably resilient amid the December downdraft, surviving a jagged test of its corresponding breakout point (4,545).
Each benchmark’s prevailing backdrop supports a bullish intermediate-term bias. (To be sure, the prevailing backdrop is not without “watch outs” amid a relatively prolonged volatility patch.)
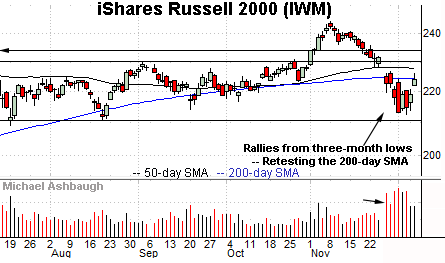
Moving to the small-caps, the iShares Russell 2000 ETF has reversed from three-month lows.
A retest of the 200-day moving average, currently 224.38, is underway from underneath.
On further strength, the former range top (229.84) remains an overhead inflection point.
Meanwhile, the SPDR S&P MidCap 400 ETF remains comparably stronger than the Russell 2000.
As illustrated, the mid-cap benchmark has reclaimed its former breakout point (506.00) an area closely matching the 50-day moving average.
The prevailing backdrop supports a bullish intermediate-term bias to the extent this area is maintained.
Returning to the S&P 500, the index seems to have weathered a pronounced post-Thanksgiving market whipsaw.
Caveat emptor
It’s worth noting the S&P 500 has registered a 1.0% daily move (or greater) across six of the prior seven sessions, its first such stretch this year. The “watch out” is that pronounced volatility persists, making the prevailing bullish reversal more closely resemble a market convulsion amid the early innings of a major trend shift.
Separately, the prevailing upturn has been fueled by respectable, but not off-the-charts, bullish internals. For instance, Tuesday’s directionally sharp rally registered just above 5-to-1 positive breadth on the NYSE.
By comparison, the preceding downturn initiated with two 9-to-1 down days across a narrow three-session window.
Put differently, market momentum is internally conflicted against the prevailing backdrop.
Bull trend gets benefit of doubt amid volatility spike
Reservations aside, price action, as always, trumps other indicators.
And as detailed previously, the S&P 500’s technical backdrop remains relatively straightforward.
Tactically, the 50-day moving average, currently 4,559, is closely followed by the marquee breakout point (4,545).
Broadly speaking, the S&P 500’s bullish intermediate-term bias gets the benefit of the doubt barring a sustained violation of this area.
(On a granular note, the rate-sensitive sectors — including the utilities and real estate sector — have broken out this week, price action consistent with a less-hawkish-than-feared Federal Reserve policy tilt.)
Watch List
Drilling down further, the 10-year Treasury note yield has whipsawed amid key technical levels.
Specifically, the yield started December with a downdraft, pressured amid a violation of the 200-day moving average. (A safe-haven trade contributed to the yield’s downturn, even amid the Federal Reserve’s hawkish policy tilt, which “should” have sent the yield higher.)
The yield subsequently nailed the 2016 low (1.34) — a level defining the 2020 breakdown point — as well as the pivot from pandemic-zone territory. (See the Sept. 8 review, as the yield’s September breakout was taking shape.)
From current levels, the 1.50 area marks an overhead inflection point, matching the 200-day moving average, currently 1.49. Upside follow-through would open the path to a higher pleateau, a move consistent with supporting the Fed’s objective of containing inflation.
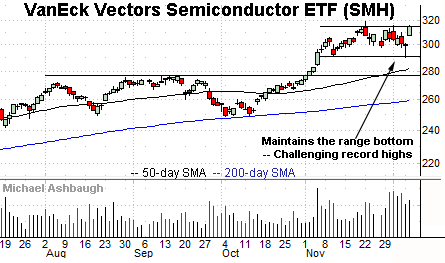
Moving to U.S. sectors, the VanEck Vectors Semiconductor ETF is acting well technically.
The group initially spiked five weeks ago, knifing to record highs. The breakout punctuated a double bottom defined by the August and October lows. (See the successful test of the 200-day moving average at the October low.)
More immediately, the prevailing one-month range is a bullish continuation pattern.
Tactically, the range bottom (290.50) marks a well-defined floor. Conversely, a near-term target projects to the 336 area on follow-through.
Applied Materials is a well positioned large-cap chip equipment name.
As illustrated, the shares have rallied to the range top, rising to press record highs.
More broadly, the shares are well positioned on the five-year chart, rising from a prolonged continuation pattern hinged to the massive early-2021 rally.
Tactically, a breakout attempt is in play barring a violation of support, circa 145.80.
Pfizer, Inc. is a well positioned large-cap name. (Yield = 3.0%.)
Late last month, the shares gapped to record highs, rising amid omicron’s emergence as a new variant.
The subsequent pullback places the shares 7.7% under the November peak.
Tactically, the December low (50.40) has closely matched the breakout point (50.42). A sustained posture higher signals a bllish bias.
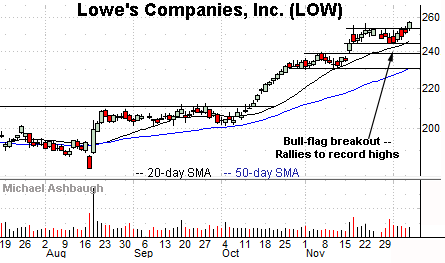
Lowe’s Companies, Inc. is a well positioned large-cap home-improvement retailer.
Technically, the shares have tagged record highs, clearing resistance matching the November peak.
The prevailing upturn punctuates consecutive flag patterns, tight ranges hinged to the steep October rally.
Tactically, the 20-day moving average, currently 246.50, is closely followed by the former range bottom (244.50). The prevailing uptrend is intact barring a violation.
Finally, On Semiconductor Corp. is a well positioned large-cap name.
The shares initially spiked five weeks ago, gapping sharply higher after the company’s third-quarter results.
More immediately, the prevailing upturn punctuates a flag-like pattern — the tight late-November range — positioning the shares to build on the initial earnings-fueled spike.
Tactically, the breakout point (64.00) is followed by the former range bottom (59.50). A sustained posture higher signals a firmly-bullish bias.


