S&P 500 plunges from major resistance as Treasury yields take flight
Focus: 10-year Treasury note yield tags 11-year high, Volatility Index (VIX) remains 'relatively' complacent for market conditions
Technically speaking, the major U.S. benchmarks have notched multi-month lows, confirming a primary downtrend.
The prevailing pullback has been punctuated by unusually aggressive breadth — borderline off-the-charts — amid a sentiment backdrop still signaling complacency for market conditions.
Editor’s Note: As always, updates can be directly accessed at https://chartingmarkets.substack.com.
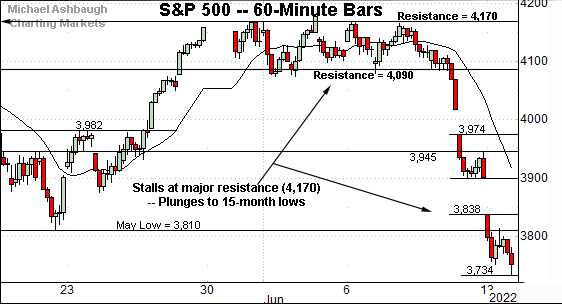
Before detailing the U.S. markets’ wider view, the S&P 500’s hourly chart highlights the past four weeks.
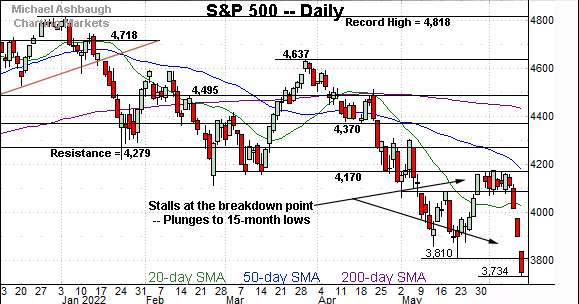
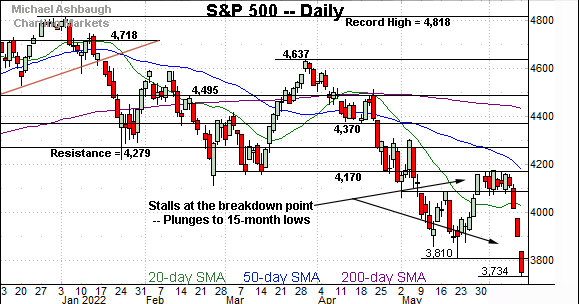
As illustrated, the S&P 500 has plunged from major resistance (4,170).
Selling pressure accelerated amid the violation of major support (4,090) detailed previously.
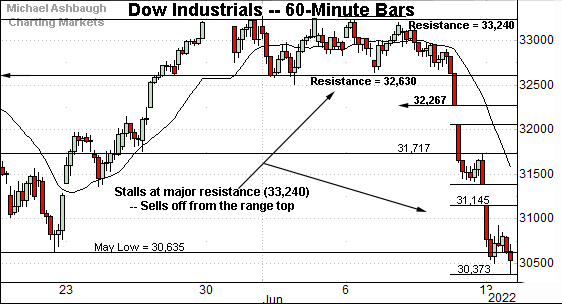
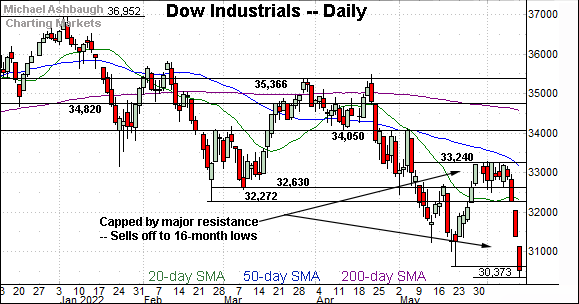
Similarly, the Dow Jones Industrial Average has fallen off a cliff, selling off sharply from major resistance (33,240).
Here again, selling pressure accelerated amid the violation of major support (32,630), an area detailed previously.
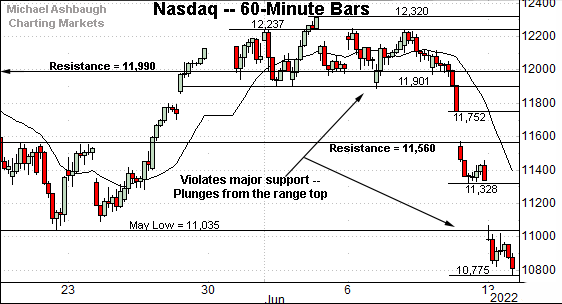
Against this backdrop, the Nasdaq Composite has also turned firmly lower.
The prevailing downturn punctuates a tight early-June range.
Tactically, the May low (11,035) pivots to resistance.
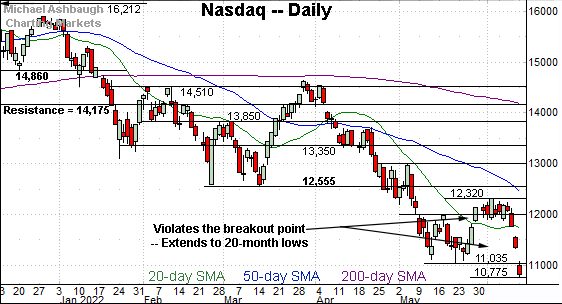
Widening the view to six months adds perspective.
On this wider view, the Nasdaq has reached 20-month lows.
From its record high — established Nov. 22, 2021 — the index has dropped as much as 5,437 points, or 33.5%.
Tactically, the May low (11,035) is closely followed by gap resistance (11,071). The pending retest from underneath may add color.
Looking elsewhere, the Dow Jones Industrial Average has reached 16-month lows.
The aggressive downdraft originates from major resistance (33,240).
From its record high — established Jan. 5, 2022 — the index has dropped as much as 6,579 points, or 17.8%.
Meanwhile, the S&P 500 has registered 15-month lows.
The mid-June plunge punctuates a failed test of major resistance (4,170).
From its record high — established Jan. 4, 2022 — the index has dropped as much as 1,084 points, or 22.5%.
The bigger picture
As detailed above, the major U.S. benchmarks are not acting well technically.
On a headline basis, the S&P 500 and Dow industrials have registered multi-month lows, plunging from major resistance — the S&P 4,170 and Dow 33,240 areas — detailed previously. (See for instance, the June 2 review.)
Against this backdrop, each benchmark’s bigger-picture trends remain firmly-bearish.
Moving to the small-caps, the iShares Russell 2000 ETF (IWM) has not yet registered new lows.
Still, the small-cap benchmark has plunged from its 50-day moving average, pressured amid increased volume.
Tactically, a retest of the May low (168.90) remains underway. Conversely, gap resistance (174.96) is followed by firmer overhead in the 181.50-to-181.80 area.
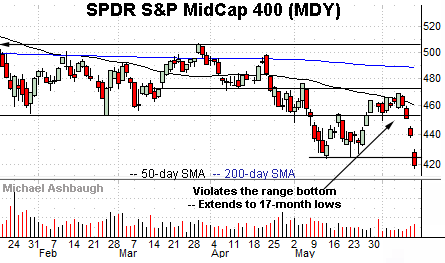
Meanwhile, the SPDR S&P MidCap 400 ETF (MDY) has tagged 17-month lows.
Here again, the downturn originates from the 50-day moving average, a familiar year-to-date inflection point.
More broadly, the MDY’s aggressive plunge confirms its primary downtrend. The prior three-month range marked a bearish continuation pattern that has indeed follow-through lower.
Market breadth once again registers bearish extremes
Moving to market breadth, already-aggressive selling pressure has accelerated amid the prevailing leg lower.
To start, the NYSE registered a 12-to-1 down day Thursday, and a nearly 8-to-1 down day Friday. (Declining volume surpassed advancing volume by the stated margin.)
Then, the floodgates truly opened amid Monday’s massive 60-to-1 down day.
As always, in a textbook world, two 9-to-1 down days — across about a seven-session window — reliably signal a major trend shift.
In this case, the three consecutive aggressive daily plunges, confirm the primary downtrend, already in play.
Tactically, persistent broadly-based selling pressure on this order is generally not a bullish signal of market capitulation. Instead, it signals a selling stampede that’s intact pending signs to the contrary. (Also see the May 10 review, detailing the same point.)
Though corrective bounces have registered, and will continue to, the aggressive downdrafts are not buying opportunities for the long-term.
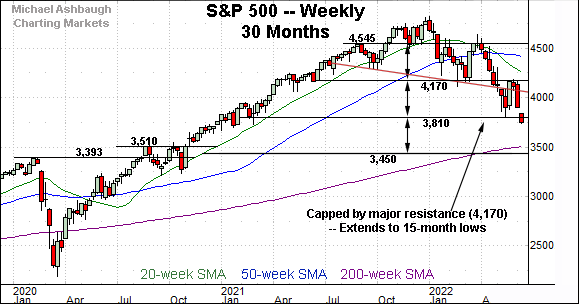
Returning to the S&P 500, this next chart is a weekly view, spanning 30 months. Each bar on the chart represents one week.
As illustrated, the index has reached a lower plateau, venturing under the 3,800 mark.
The prevailing downturn originates almost precisely from major resistance (4,170).
Tactically, the 3,810 area pivots to notable overhead.
Conversely, the S&P’s next downside target projects to the 3,450 area. Note the pre-pandemic peak (3,393) rests in the vicinity.
Also see the April 29 review, as the S&P 500 challenged the 4,170 support: Charting the S&P 500's precarious backdrop as currency trends accelerate.
Returning to the six-month view, the S&P 500 has confirmed its primary downtrend.
Tactically, the May low (3,810) is followed by this week’s gap (3,838). A close higher might be noteworthy.
Beyond technical levels, market sentiment — as measured by the the CBOE Volatility Index (VIX) — remains complacent in the current market context. Ideally, for market bulls, the VIX would be notching a “higher high” as the S&P 500 extends to its latest “lower low.” (See this link detailing the VIX’ backdrop.)
That’s not happening — at least not yet — leaving the S&P 500 prone to incremental downside, based on the prevailing sentiment backdrop.
Collectively, the recent price action (failed tests of resistance), market breadth (9-to-1 down days) and sentiment backdrop (as measured by VIX) signal a still firmly-bearish bigger-picture backdrop, pending repairs.
Watch List — 10-Year yield extends to way less-charted territory
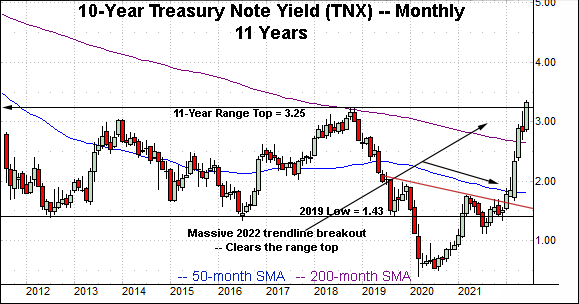
Concluding on a stray note, the 10-year Treasury note yield (TNX) has reached genuinely less-charted territory.
Specifically, the yield has knifed to 11-year highs, placing distance atop the 2018 peak (3.25). (See the monthly chart.)
As detailed last week, the breakout opens the path to a potentially significant incremental upturn, possibly rivaling the nearly 150 basis point March-through-May spike.
The response to the Federal Reserve’s policy directive, due out Wednesday, will likely add color. A 75 basis point rate hike is now widely expected.


