Charting a market whipsaw, S&P 500 absorbs post-Thanksgiving downdraft
Focus: The traditional sector leaders diverge (slightly), Financials violate major support while tranports and technology sector exhibit relative strength
U.S. stocks are higher mid-day Monday, rising in the wake of this year’s biggest single-day market downdraft.
Against this backdrop, the S&P 500 and Nasdaq Composite have maintained a posture atop major support — the S&P 4,545 and Nasdaq 15,400 areas — preserving a still comfortably bullish intermediate-term bias.
Editor’s Note: As always, updates can be directly accessed at chartingmarkets.substack.com.
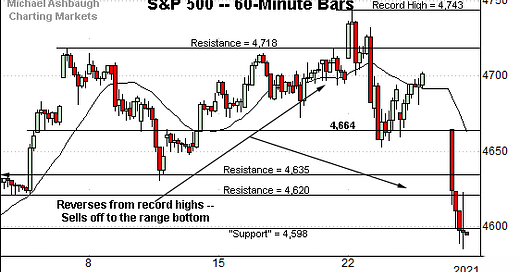
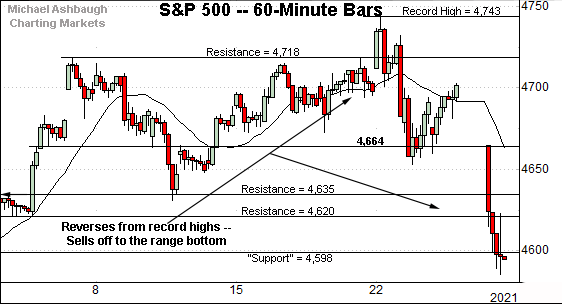
Before detailing the U.S. markets’ wider view, the S&P 500’s hourly chart highlights the past four weeks.
As illustrated, the S&P has reversed sharply from record highs.
Last week’s close (4,594.6) placed it slightly under an inflection point around the 4,600 mark.
Tactically, the breakdown point — the 4,620-to-4,635 area — pivots to resistance. More distant overhead matches last week’s gap (4,664).
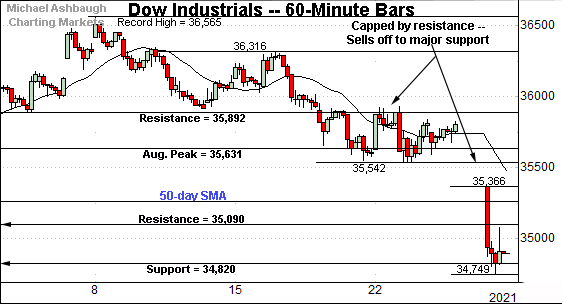
Meanwhile, the Dow Jones Industrial Average remains the weakest major benchmark.
In fact, the index has tagged six-week lows, placing distance under its 50-day moving average, currently 35,270.
The prevailing downturn punctuates a failed test of the October peak (35,892) from underneath.
More immediately, the index has initially maintained major support (34,820) an area better illustrated on the daily chart.
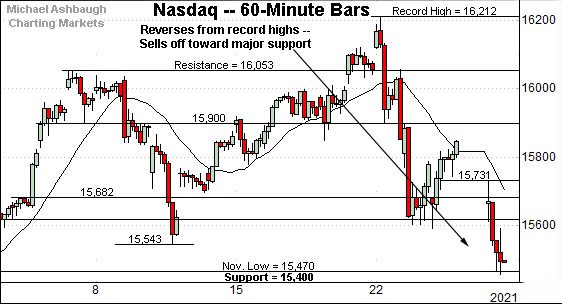
Against this backdrop, the Nasdaq Composite has also sold off to its range bottom.
Still, the downturn has been underpinned by major support — the 15,400 area — also illustrated below.
The quality of the prevailing rally from this area will likely add color.
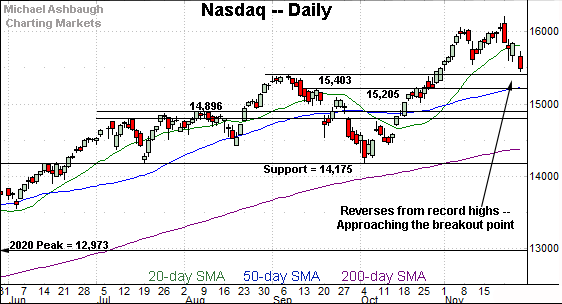
Widening the view to six months adds perspective.
On this wider view, the Nasdaq has reversed respectably from recent record highs.
Still, the downturn has been underpinned by the breakout point (15,403) an area marking its first significant support. (A closing violation of this area would raise a question mark.)
Delving deeper, the 50-day moving average, currently 15,238, is closely followed by the former range top (15,205). A sustained posture atop this area signals a bullish intermediate-term bias.
(On a granular note, recall the Nasdaq’s gravestone doji near the November peak — detailed previously — a pattern punctuated by last week’s massive bearish engulfing pattern. The long red bar.)
Looking elsewhere, the Dow industrials’ downdraft has inflicted damage.
Specifcially, the index has violated its breakout point (35,630) and the 50-day moving average, currently 35,270.
Likely last-ditch support matches the Dow’s former range top (34,820). Tactically, the Dow’s bullish intermediate-term bias gets the benefit of the doubt barring follow-through under this area.
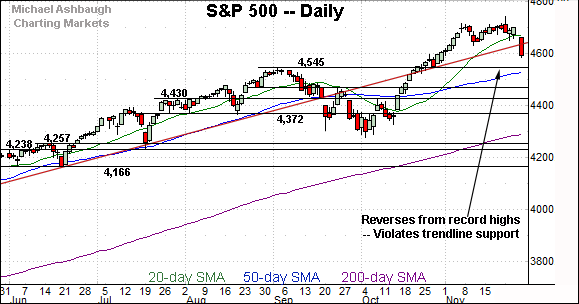
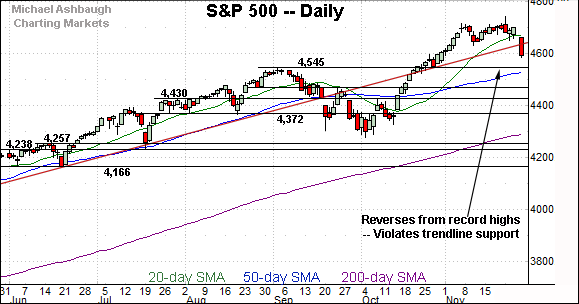
Meanwhile, the S&P 500 has pulled in respectably from last week’s record high.
The weekly close registered under trendline support, circa 4,635.
Delving deeper, the breakout point (4,545) remains a more important floor.
The bigger picture
Collectively, the major U.S. benchmarks remain in divergence mode in the wake of this year’s worst single-day market downdraft.
On a headline basis, the S&P 500 and Nasdaq Composite have maintained a posture atop major support — the S&P 4,545 and Nasdaq 15,400 areas — preserving a still comfortably bullish intermediate-term bias.
Elsewhere, the Dow Jones Industrial Average has tagged six-week lows, violating major support (35,630) as well as its 50-day moving average.
More broadly, the market whipsaw has been punctuated by a rotation toward the stay-at-home trade, and away from the re-opening trade. This rotation, and re-rotation, is a relatively familiar trait of the prevailing bull trend.
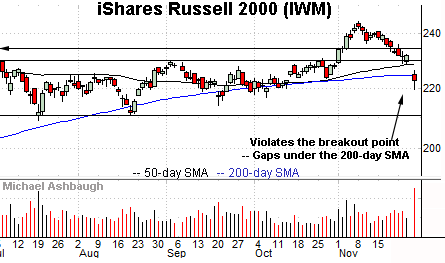
Moving to the small-caps, the iShares Russell 2000 ETF has reversed to its former range.
In the process, the small-cap benchmark has violated its breakout point (229.80) as well as the 50- and 200-day moving averages.
Tactically, the 50-day moving average, currently 228.28, is closely followed by gap resistance (228.54). A swift reversal higher would likely neutralize the November downdraft.
The pending retest from underneath should be a useful bull-bear gauge.
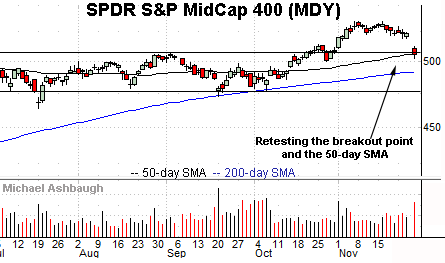
Meanwhile, the SPDR S&P MidCap 400 ETF remains relatively stronger than the small-cap benchmark.
As illustrated, the MDY has initially maintained its breakout point, circa 506.00, an area closely matching the 50-day moving average, currently 506.76.
An extended retest remains underway.
Placing a finer point on the S&P 500, the index has reversed sharply from record territory.
Tactically, the breakdown point — the 4,620-to-4,635 area — pivots to resistance.
The S&P has ventured atop this area early Monday. A sustained break higher, and close near current levels, would place the brakes on bearish momentum.
More distant overhead matches last week’s gap (4,664).
Market breadth registers bearish extremes, in spots
Beyond technical levels, Friday’s post-Thanksgiving downdraft registered bearish extremes in spots.
Specifically, advancing volume surpassed declining volume by a greater than 9-to-1 margin on the NYSE, and a comparably pedestrian 2-to-1 margin on the Nasdaq.
(Recall the stay-at-home trade insulated the Nasdaq from extreme selling pressure.)
Amid normal market conditions, the 9-to-1 NYSE down day would raise a caution flag. A comparable downdraft, across about the next seven sessions, would reliably signal a material trend shift.
But placed in context, Friday’s half-session, Thanksgiving-related downdraft is difficult to take seriously.
Returning to the S&P 500’s six-month view, familiar inflection points stand out.
As detailed repeatedly, trendline support, circa 4,635, is closely followed by the post-breakout low (4,630). The S&P has reversed atop this area early Monday.
Delving deeper, the breakout point (4,545) remains a more important floor. The 50-day moving average, currently 4,531, is rising toward the breakout point.
As always, it’s not just what the markets do, it’s how they do it. But generally speaking, the S&P 500’s intermediate-term bias remains bullish barring a violation of the 4,540 area.
The monthly close, and the next several sessions, will likely add color.
Watch List — Charting the traditional sector leaders
Drilling down further, last week’s market downdraft inflicted sub-sector damage, in spots, though the prevailing backdrop remains bullish-leaning.
The traditional sector leaders — the financials, transports and technology sector — exemplify the landscape:
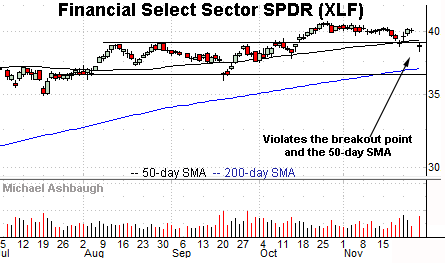
To start, the Financial Select Sector SPDR has ventured under major support.
The specific area matches the group’s breakout point, circa 39.10, and the 50-day moving average, currently 39.26.
A retest of this area remains underway early Monday.
Tactically, a relatively swift reversal higher would preserve the group’s bullish intermeidate-term bias.
Conversely, a failed test from underneath — punctuated by downside follow-through — would raise the flag to a bearish intermediate-term trend shift.
Meanwhile, the Dow Transports remain comparably resilient.
To be sure, the group has pulled in from recent record highs, pressured amid a volume spike.
Still, the downturn has thus far been underpinned by the breakout point — the 15,940-to-15,966 area. The transports’ backdrop remains bullish barring a violation.
Delving deeper, the group’s 50-day moving average, currently 15,570, has marked an inflection point, formerly matching the October trendline breakout.
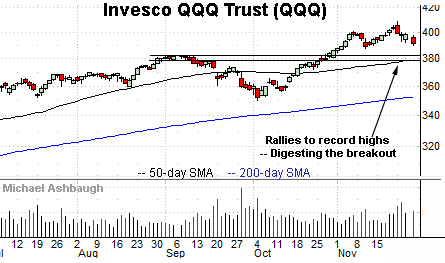
Finally, the Invesco QQQ Trust tracks the Nasdaq 100 Index, and as always, serves as a large-cap technology sector proxy.
This is the strongest of the traditional sector leaders, positioned comfortably atop the post-breakout low (387.53). (Also the early-November low.)
More broadly, the November range is a continuation pattern, hinged to the previously steep rally off the October low. Tactically, a sustained posture atop the breakout point (382.00) signals a firmly-bullish bias.

