Charting market cross currents, Nasdaq reverses from record highs
Focus: Basic materials sustain break to record territory, Home Depot takes flight, XLB, HD, PLUG, SAIL, CAR, KGC
Technically speaking, a mid-November market divergence remains underway across the major U.S. benchmarks.
Amid the cross currents, the U.S. sub-sector price action remains rotational, on balance, supporting a bullish intermediate-term bias based on today’s backdrop.
Editor’s Note: As always, updates can be directly accessed at chartingmarkets.substack.com.
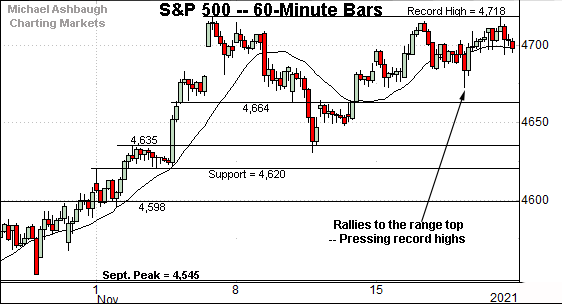
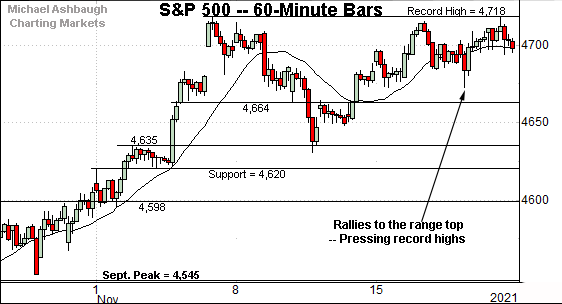
Before detailing the U.S. markets’ wider view, the S&P 500’s hourly chart highlights the past four weeks.
As illustrated, the S&P continues to hold its range top.
In fact, last week’s high (4,717.75) registered less than one point under the S&P’s absolute record peak (4,718.50).
A breakout attempt remains underway.
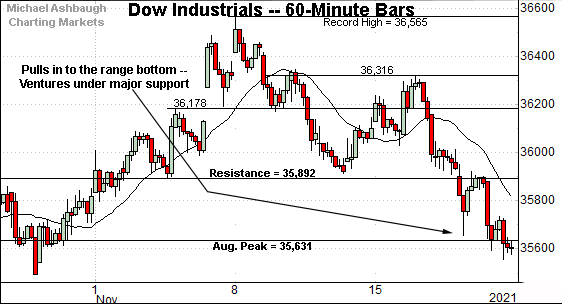
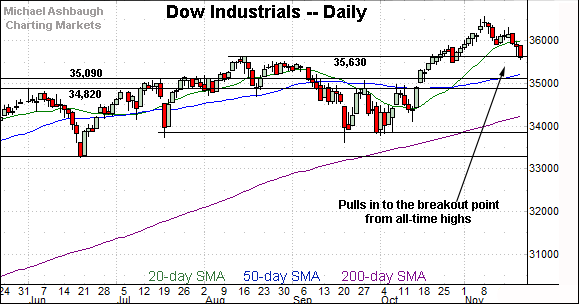
Meanwhile, the Dow industrials’ backdrop remains comparably softer.
Consider that last week’s close (35,602) registered slightly under major support (35,631) an area also detailed on the daily chart.
Tactically, the 35,630 area is followed by more distant overhead matching the October peak (35,892).
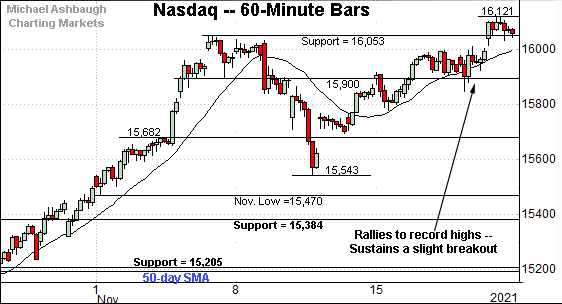
Against this backdrop, the Nasdaq Composite has tagged a nominal record high, notching its first-ever close atop the 16,000 mark.
Tactically, the breakout point (16,053) is followed by a deeper floor around the 15,900 mark.
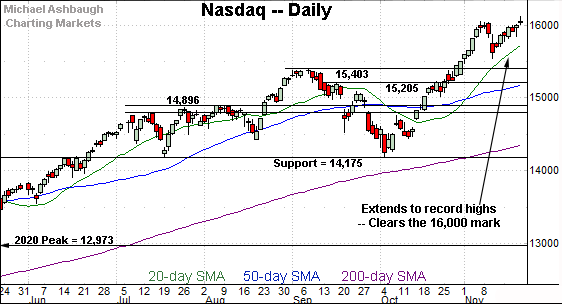
Widening the view to six months adds perspective.
On this wider view, the Nasdaq has extended its uptrend, closing atop the 16,000 mark for the first time on record.
The slight breakout has been punctuated by a gravestone doji, a bearish single-day pattern. (See the upside down cross, defined by a session open and close that closely match, registering near session lows.)
Monday’s early downside follow-through — to the former range — suggests a more prolonged consolidation phase may be in order.
Beyond near-term issues, the Nasdaq’s bigger-picture backdrop remains firmly-bullish. An intermediate-term target continues to project to the 16,550 area.
Looking elsewhere, the Dow Jones Industrial Average has pulled in to major support.
Recall last week’s close (35,602) registered slightly under the breakout point (35,630). Monday’s early upturn punctuates a successful retest of this area.
Delving deeper, the 50-day moving average, currently 35,218, is followed by the May peak (35,091). The Dow’s intermediate-term bias remains bullish barring a violation of this area.
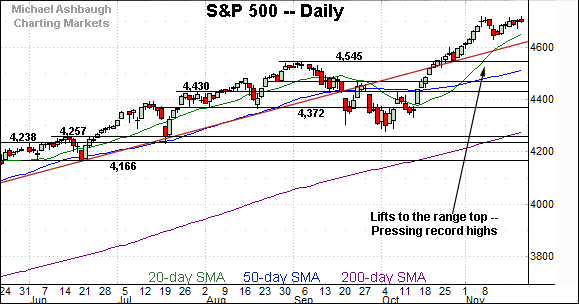
Meanwhile, the S&P 500’s backdrop splits the difference between that of the other benchmarks.
The prevailing flag-like pattern — the tight mid-November range — signals still muted selling pressure near record highs. Constructive price action.
The bigger picture
Though the major U.S. benchmarks have diverged in recent sessions, the bigger-picture backrop, on balance, remains comfortably bullish.
On a headline basis, the Nasdaq Composite has staged a lukewarm break to record highs, a move punctuated by a bearish single-day reversal pattern. (Single-day patterns are generally not a concern in the context of a powerful primary uptrend.)
Meanwhile, the Dow Jones Industrial Average has pulled in to major support (35,630) from record highs.
Against this backdrop, the S&P 500 continues to challenge record highs, rising amid rotational price action.
Collectively, each benchmark’s intermediate-term bias remains bullish, based on today’s backdrop.
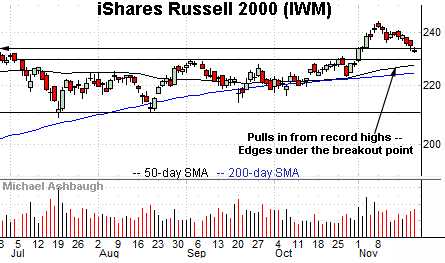
Moving to the small-caps, the iShares Russell 2000 ETF has extended its pullback from recent record highs.
Tactically, the former breakout point (234.50) marks an overhead inflection point.
Conversely, the former range top (229.80) is closely followed by the 50- and 200-day moving averages.
More broadly, recall the early-November rally marked a statistically unusual two standard deviation breakout, encompassing six straight closes atop the 20-day volatility bands.
In this context, the “expected” pullback remains underway, amid a still firmly-bullish longer-term outlook.
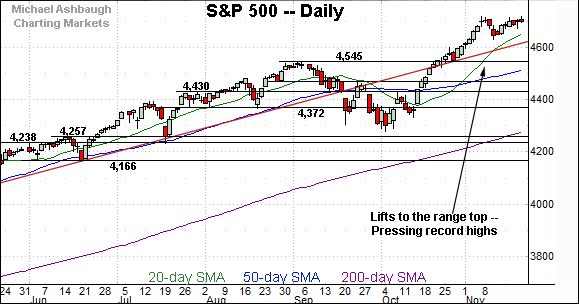
Placing a finer point on the S&P 500, the index is acting well technically.
Recall the prevailing upturn punctuates a relatively shallow pullback, underpinned by near-term support — the 4,620-to-4,635 area.
More immediately, selling pressure near the range top remains muted.
Returning to the S&P 500’s six-month view, familiar inflection points stand out.
To start, the post-breakout low (4,630) is closely followed by trendline support, circa 4,620.
Delving deeper, the breakout point (4,545) remains a more important floor. (The S&P’s 50-day moving average, currently 4,516, is grinding toward the breakout point.)
As always, it’s not just what the markets do, it’s how they do it. But generally speaking, the S&P 500’s intermediate-term bias remains bullish barring a violation of the 4,540 area.
Beyond specific levels, this is a holiday-shortened week in the U.S. a backdrop typically translating to decreased volume. Material trend shifts rarely register without volume.
Editor’s Note: This is the last review until next Monday, Nov. 29. The U.S. markets are closed Thursday, Nov. 25 for Thanksgiving. Have a great holiday!
Watch List
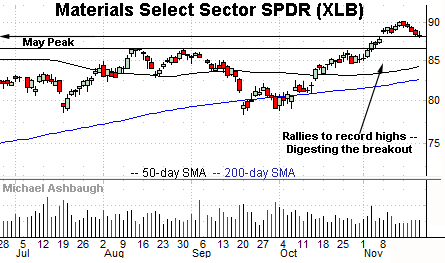
Drilling down further, the Materials Select Sector SPDR is acting well technically. (Yield = 1.6%.)
Earlier this month, the shares reached record highs, clearing resistance matching the May peak on increased volume.
By comparison, the prevailing pullback has been flat, placing the group 2.1% under the November peak.
More broadly, the November breakout punctuates a double bottom defined by the July and September lows. Tactically, a sustained posture atop the former range top (86.60) signals a comfortably bullish bias.
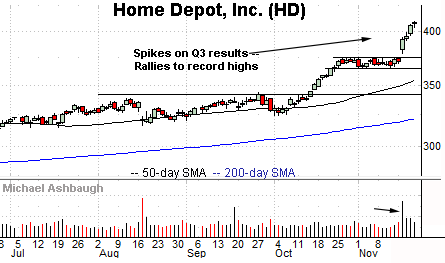
Moving to specific names, Home Depot, Inc. is a Dow 30 component taking flight. (Yield = 1.6%.)
As illustrated, the shares have knifed to all-time highs, rising after the company’s third-quarter results. The nearly straightline spike punctuates a tight three-week range, hinged to the steep October rally.
Though near-term extended, and due to consolidate, the shares are attractive on a pullback. Tactically, a near-term floor, circa 407.00, is followed by gap support (379.00) and the firmer breakout point (375.15).
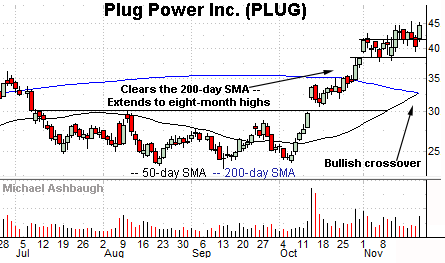
Initially profiled Oct. 29, Plug Power, Inc. has returned 16.4% and remains well positioned.
Late last month, the shares knifed atop the 200-day moving average, reaching eight-month highs.
The shares have since formed consecutive flag-like patterns — (bullish continuaiton patterns) — hinged to the steep October rally. Tactically, the prevailing rally attempt is intact barring a violation of support, circa 41.80.
Separately, a golden cross — or bullish 50-day/200-day moving average crossover — signaled Friday. The crossover signals the intermediate-term uptrend has overtaken the longer-term trend.
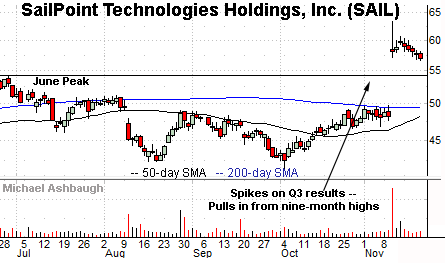
SailPoint Technologies Holdings, Inc. is a well positioned large-cap cybersecurity name.
Earlier this month, the shares gapped to nine-month highs, rising after the company’s quarterly results.
The ensuing pullback has been fueled by decreased volume, placing the shares 11.3% under the November peak.
On futher weakness, the June peak (54.05) marks a notable floor. A sustained posture atop this area signals a bullish intermediate-term bias.
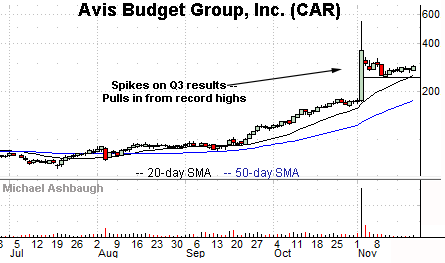
Avis Budget Group, Inc. is a well positioned large-cap name.
The shares started November with a massive breakout, knifing to record highs after the company’s third-quarter results.
By comparison, the subsequent pullback has been flat, positioning the shares to build on the initial spike.
Tactically, the 20-day moving average, currently 255.90, is followed by the post-breakout low (245.20). The prevailing rally attempt is intact barring a violation.
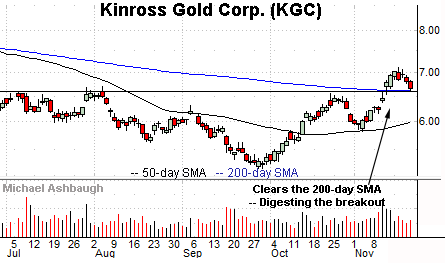
Finally, Kinross Gold Corp. is a large-cap Canada-based gold miner.
As illustrated, the shares have recently cleared the 200-day moving average, rising from a head-and-shoulders bottom defined by the July, September and November lows.
More immediately, the prevailing pullback places the shares 6.9% under the November peak.
Tactically, the 200-day moving average, currently 6.62, closely matches the breakout point (6.55). A sustained posture higher signals a bullish bias.
Editor’s Note: This is the last review until next Monday, Nov. 29. The U.S. markets are closed Thursday, Nov. 25 for Thanksgiving. Have a great holiday!


