Bearish momentum persists, S&P 500 back for latest crack at 50-day average
Focus: Silver's breakout attempt, Walmart challenges key trendline, Tesla violates 200-day average, VIX signals complacency for the circumstances
U.S. stocks are firmly lower early Wednesday, pressured amid lingering inflation worries ahead of the Federal Reserve’s meeting minutes, due out this afternoon.
Against this backdrop, the S&P 500 has ventured back under major support, pulling in to a second recent test of the 50-day moving average, currently 4,080.
Editor’s Note: As always, updates can be directly accessed at chartingmarkets.substack.com. Your smartphone can also access updates at the same address, chartingmarkets.substack.com.
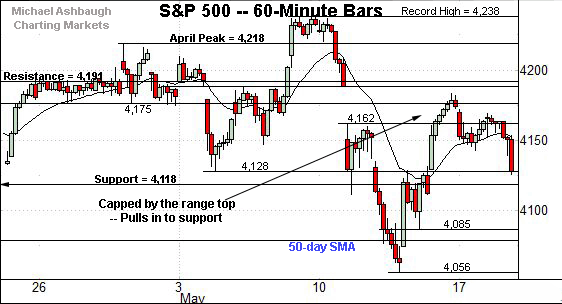
Before detailing the U.S. markets’ wider view, the S&P 500’s hourly chart highlights the past four weeks.
As illustrated, the S&P has balked at its range top. Tuesday’s close (4,127.8) closely matched near-term support (4,128).
More immediately, the S&P has extended its downturn early Wednesday.
Tactically, the 50-day moving average, currently 4,080, is followed by the May low (4,056.9).
Meanwhile, the Dow Jones Industrial Average has pulled back into its former range.
The downturn has accelerated early Wednesday.
Tactically, familiar support (33,800) is followed by the former range bottom (33,687) and the May low (33,555).
Perhaps not surprisingly, the Nasdaq Composite remains the weakest major benchmark.
As illustrated, the index has failed to sustain Tuesday’s brief trendline breakout. (The Nasdaq has also balked near resistance matching the early-April gap (13,404).)
Slightly more broadly, the Nasdaq’s rally attempt has stalled firmly under its 50-day moving average, an area also illustrated below.
Widening the view to six months adds perspective.
On this wider view, the Nasdaq seems to have registered a corrective bounce from the May low.
To be sure, the initial upturn registered as internally strong, fueled by nearly 8-to-1 positive breadth.
Nonetheless, material upside follow-through has thus far been absent. In fact, the Nasdaq has struggled to sustain a break atop its first notable resistance — the 13,404-to-13,423 area, detailed previously. (See the May 12 review.)
Last week’s close (13,429) registered nearby to punctuate the prevailing rally’s apex on a closing basis. At least so far.
Tactically, the 13,000 mark is closely followed by the 2020 peak (12,973). An eventual violation opens the path to a less-charted patch, and potential retest of the 200-day moving average.
Beyond the details, the Nasdaq’s intermediate-term bias remains bearish.
Looking elsewhere, the Dow Jones Industrial Average has whipsawed in the wake of an early-May record high.
Against this backdrop, the 33,800 support is followed by the 50-day moving average, currently 13,578.
The 50-day moving average roughly matches the May low (33,555). A retest is underway early Wednesday.
Tactically, a violation of the May low would mark a “lower low” — combined with a violation of the 50-day — raising a technical question mark.
Delving deeper, likely last-ditch support matches the early-April gap (13,222).
Similarly, the S&P 500 has whipsawed amid jagged May price action.
More immediately, the index has ventured back under its range bottom (4,118) early Wednesday.
Tactically, the 50-day moving average, currently 4,080, is followed by the May low (4,056.9).
The bigger picture
Collectively, the major U.S. benchmarks remain in divergence mode in the wake of a mid-May market bounce.
Against this backdrop, the S&P 500 and Dow industrials have thus far retained a bullish intermediate-term bias.
Still, both benchmarks have challenged the 50-day moving average early Wednesday, pressured amid intraday selling pressure firmly exceeding bearish extremes. NYSE declining volume has surpassed advancing volume by a greater than 18-to-1 margin.
As always, it’s the closing internal readings that matter.
Meanwhile, the Nasdaq Composite’s intermediate-term bias remains bearish-leaning. Its mid-May corrective bounce has stalled near first resistance, detailed previously.
Moving to the small-caps, the iShares Russell 2000 ETF remains range-bound, and capped by the 50-day moving average.
Tactically, the former range bottom (215.24) is closely followed by the May low (211.54).
Meanwhile, the SPDR S&P MidCap 400 remains comparably stronger.
Tactically, the MDY’s breakout point (489.50) is followed by the 50-day moving average, currently 487.14. The MDY has ventured under its 50-day early Wednesday.
Delving deeper, the May low (478.88) is followed by firmer support, circa 470.60.
Placing a finer point on the S&P 500, the index has registered jagged May price action to start the worst six months seasonally.
Market bears will point to a false breakout at record highs — subsequent sharp downdraft to one-month lows — and the comparably lackluster rally attempt, capped by the range top (4,191).
A second test of the 50-day moving average, currently 4,080, is underway early Wednesday.
More broadly, the prevailing bigger-picture backdrop is largely the same — in a technical sense — as it has been.
Namely, the S&P 500’s intermediate-term bias remains bullish, while the Nasdaq’s remains bearish.
Nonetheless, Tuesday’s late-session downturn — across the final 15 minutes — and Wednesday’s early downside follow-through raise a technical question mark.
The prevailing selling pressure has registered as internally extreme against a sentiment backdrop, as measured by the CBOE Volatility Index, that is less than ideal for market bulls.
(To the extent the S&P 500 would register a “lower low” Wednesday as the Volatility Index registers a “lower high” vs. the May peak, such a backdrop would signal that an intermediate-term S&P 500 low has likely not been established. To be sure, the inversion just described has not yet registered, though the prospect is a “watch out” against the prevailing backdrop.)
As always, it’s not just what a benchmark does, it’s how it does it. The response to the Federal Reserve’s meeting minutes, and the next several sessions, will likely add color.
But generally speaking, the S&P 500’s bullish intermediate-term bias gets the benefit of the doubt barring a violation of the 3,980 support.
Watch List
Drilling down further, consider the following sectors and individual names:
To start, the iShares Silver Trust is acting well technically.
As illustrated, the shares have rallied to the range top, rising to challenge three-month highs. (The shares are actually pressing an eight-month range top, when excluding the single-day February island reversal.)
The prevailing upturn punctuates a massive double bottom defined by the September and March lows.
Tactically, trendline support, circa 25.20, has underpinned the prevailing rally. A breakout attempt is in play barring a violation.
Conversely, the 26.30-to-26.40 area marks major resistance. An intermediate-term target projects to the 30 area on follow-through.
Moving to specific names, Dow 30 component Walmart, Inc. is showing signs of life technically. (Yield = 1.6%.)
As illustrated, the shares have knifed to three-month highs, rising after the company’s first-quarter results.
The strong-volume spike places the shares atop trendline resistance and the 200-day moving average.
Tactically, the breakout point (142.10) is followed by the 200-day moving average, currently 140.60. The prevailing recovery attempt is intact barring a violation.
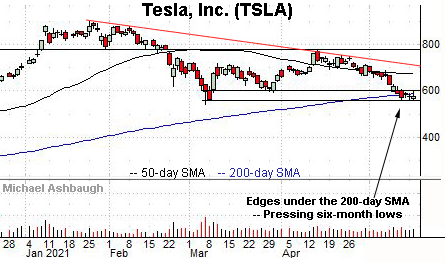
Finally, momentum favorite Tesla, Inc. is precariously positioned.
As illustrated, the shares have edged under the 200-day moving average, notching consecutive closes lower for the first time since October 2019.
As always, the 200-day is a widely-tracked primary trending indicator. The downturn raises the flag to a potential longer-term trend shift.
Tactically, the prevailing range bottom (563.00) is followed by a last-ditch inflection point matching the March low (539.50). An eventual violation opens the path to less-charted territory, and potentially material downside follow-through.
Conversely, the 200-day moving average, currently 588.20, is followed by the mid-May range top (601.60). A sustained rally atop this area would place the brakes on bearish momentum.


