May downturn accelerates, S&P 500 ventures under key support
Volatility Index extends to higher plateau -- two-month highs -- rising atop 200-day moving average
U.S. stocks are once again lower early Wednesday, pressured after a consumer price report corroborated prevailing inflationary concerns.
Against this backdrop, the S&P 500 has ventured under notable support (4,118), pressured as the Volatility Index concurrently spikes to a higher plateau atop the 200-day moving average.
Editor’s Note: As always, updates can be directly accessed at chartingmarkets.substack.com. Your smartphone can also access updates at the same address, chartingmarkets.substack.com.
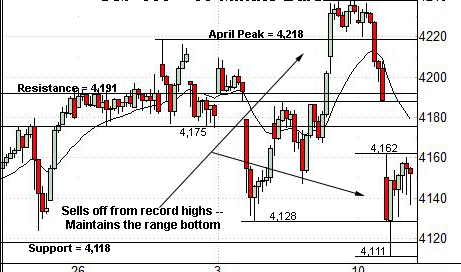
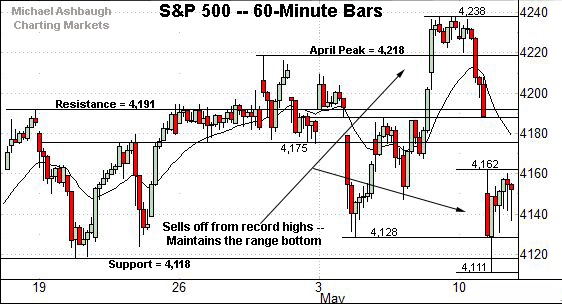
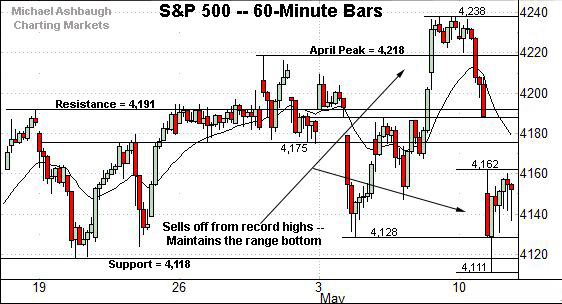
Before detailing the U.S. markets’ wider view, the S&P 500’s hourly chart highlights the past four weeks.
As illustrated, the S&P has extended a pullback from last week’s record high.
Tactically, the range bottom (4,118) has thus far underpinned the downturn on a closing basis. An extended retest remains underway early Wednesday.
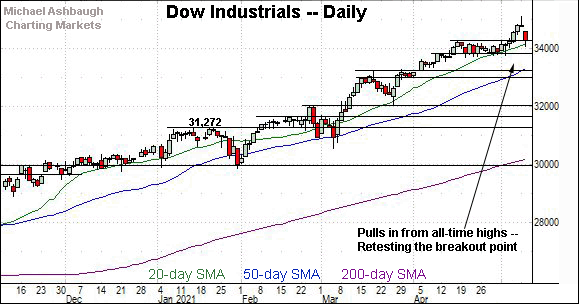
Meanwhile, the Dow Jones Industrial Average has pulled in sharply from Monday’s record high.
Tactically, the breakout point (34,256) underpinned the initial downdraft. Tuesday’s close (34,269) registered nearby.
More immediately, the Dow has extended back to its former range early Wednesday. Deeper support, circa 33,800, is followed by the one-month range bottom (33,687).
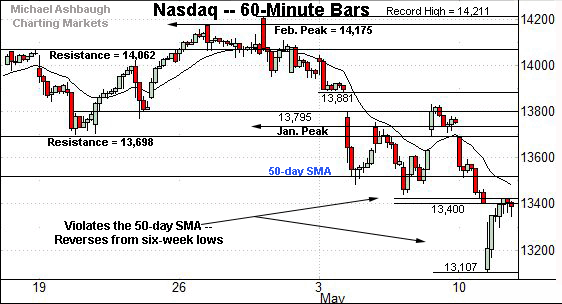
True to recent form, the Nasdaq Composite remains the weakest major benchmark.
As illustrated, the index has extended its violation of the 50-day moving average, tagging yet another six-week low (13,107).
Recall the prevailing downturn punctuates a failed test of gap resistance (13,795).
From current levels, initial resistance spans from 13,401 to 13,423 — an area matching the early-April gap (13,404) — and is followed by the 50-day moving average, currently 13,524.
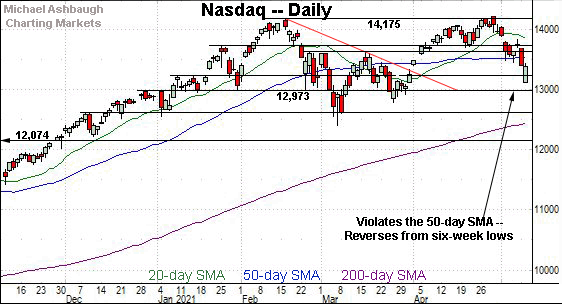
Widening the view to six months adds perspective.
On this wider view, the Nasdaq has registered consecutive closes under the 50-day moving average amid a persistent May pullback.
Its prevailing backdrop continues to support a bearish intermediate-term bias.
Tactically, a swift reversal atop the 50-day moving average — which currently looks less than likely — would mark a step toward stabilization.
More broadly, the prevailing downturn punctuates a failed test of the breakdown point (13,730) and gap resistance (13,795). Bearish price action.
On further weakness, an inflection point matches the early-January peak (13,208) and the corresponding gap (13,207). Delving deeper, the 2020 peak (12,973) remains an inflection point.
Looking elsewhere, the Dow Jones Industrial Average remains comparably stronger.
Recall that Tuesday’s close (14,269) roughly matched the breakout point (34,256) amid a successful initial retest.
The index has pulled back to its former range early Wednesday.
Tactically, familiar support, circa 33,800, is followed by the one-month range bottom (33,687).
Delving deeper, the 50-day moving average, currently 13,326, is followed by gap support (13,222). An eventual violation of the latter would raise an intermediate-term caution flag.
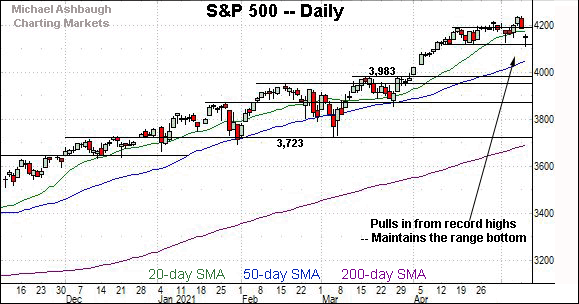
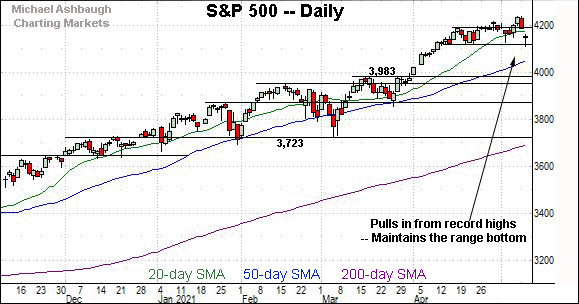
Meanwhile, the S&P 500 has pulled in to its former range to punctuate a false breakout
Tactically, a retest of the range bottom (4,118) remains underway.
Delving deeper, the S&P’s former projected target (4,085) is followed by the ascending 50-day moving average, currently 4,051.
The bigger picture
As detailed above, the major U.S. benchmarks remain in divergence mode.
On a headline basis, the Nasdaq Composite has extended a violation of its 50-day moving average, currently 13,524, pressured amid a technically damaging May downturn.
The Nasdaq’s prevailing backdrop supports a bearish intermediate-term bias, pending repairs.
Meanwhile, the S&P 500 and Dow industrials remain comparably resilient, though each index has violated notable support. Each benchmark’s intermediate-term bias remains bullish, based on today’s backdrop.
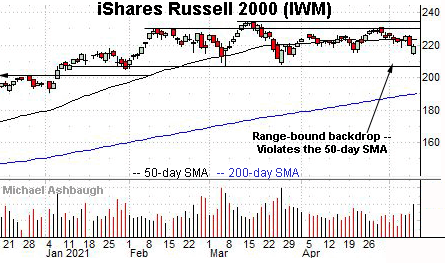
Moving to the small-caps, the iShares Russell 2000 ETF remains range-bound.
Within the range, the small-cap benchmark has notched consecutive closes under its 50-day moving average, currently 223.10.
Tactically, the April range bottom (215.24) marks a deeper floor, and is followed by the prevailing three-month range bottom (207.21).
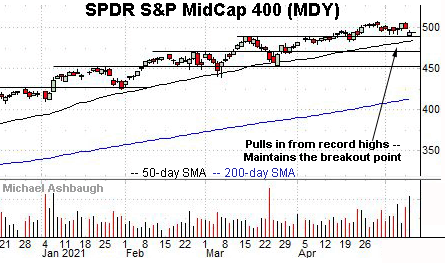
Meanwhile, the SPDR S&P MidCap 400 remains comparably stronger.
Still, an extended retest of the breakout point, circa 489.50, remains underway early Wednesday.
Combined, the small- and mid-cap benchmarks registered bullish single-day reversals Tuesday — amid increased volume — but are back on the defensive early Wednesday.
Placing a finer point on the S&P 500, the index has extended its pullback to the range.
Tactically, the index has maintained its range bottom (4,118) on a closing basis.
On further weakness, an inflection point matches its former projected target (4,085).
More broadly, the S&P’s range bottom (4,118) is followed by a less-charted patch — a potential air pocket — detailed previously.
Delving deeper, the ascending 50-day moving average, currently 4,051, is followed by the S&P’s April breakout point (3,983).
As always, it’s not just what the benchmarks do, it’s also how they do it. But as detailed repeatedly, the S&P 500’s backdrop generally supports a bullish intermediate-term bias barring a violation of the 3,980 area.
On a granular note, the CBOE Volatility Index (VIX) tagged its 200-day moving average Tuesday — nearly to the decimal — perhaps contributing to the S&P 500’s late-session bullish reversal.
The VIX has extended firmly atop the 200-day early Wednesday, reaching a higher plateau at two-month highs. Its prevailing upside follow-through suggests near-term selling pressure has not yet been exhausted, and may beget incremental pressure. The next several sessions will likely add color.
No new setups today.

