Market bears resurface, Nasdaq violates 50-day average
Focus: U.S. sector backdrop softens amid cross currents, Biotechs violate major support, QQQ, TRAN, XLF, XBI
U.S. stocks are firmly lower early Tuesday, pressured as heightened inflation concerns contribute to market rotation.
Against this backdrop, the Nasdaq Composite has extended a damaging May downdraft — placing distance under its 50-day moving average — while S&P 500 has pulled in to its range.
Editor’s Note: As always, updates can be directly accessed at chartingmarkets.substack.com. Your smartphone can also access updates at the same address, chartingmarkets.substack.com.
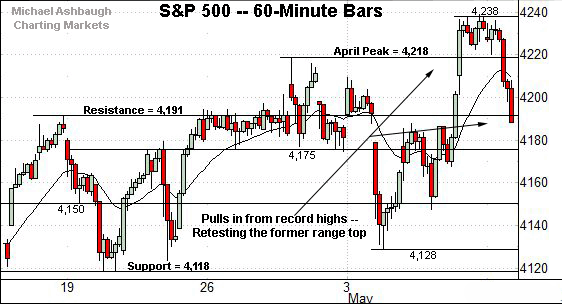
Before detailing the U.S. markets’ wider view, the S&P 500’s hourly chart highlights the past four weeks.
As illustrated, the S&P has pulled in to its range from recent record highs.
Tactically, the May low (4,128) is closely followed by the firmer range bottom (4,118). Delving deeper, the S&P’s former projected target (4,085) marks an inflection point.
Meanwhile, the Dow Jones Industrial Average has reversed from a striking 2.4% technical breakout.
Tactically, recall that near-term floors are not well-defined.
Delving deeper, the Dow’s breakout point (34,256) is followed by its former range top (34,160).
Against this backdrop, the Nasdaq Composite remains the weakest major benchmark.
As illustrated, the index has tagged six-week lows, notching its first close under the 50-day moving average since late-March.
The prevailing downturn punctuates a jagged rally attempt — or corrective bounce — effectively capped by gap resistance (13,795).
This week’s downturn also punctuates a mini bearish island reversal, defined by gaps roughly matching the breakdown point (13,698). Shaky price action.
Widening the view to six months adds perspective.
On this wider view, the Nasdaq has balked at its breakdown point in the 13,700-to-13,730 area. (Also see the hourly chart.)
Though last week’s close (13,752) registered slightly atop resistance, the index has subsequently reversed to violate its 50-day moving average, currently 13,526.
Slightly more broadly, the May 4 gap lower — subsequent failed test of gap resistance — and downside follow-through raise a caution flag.
Viewed in isolation, the Nasdaq’s backdrop supports a bearish intermediate-term bias amid a developing double top defined by the February and April peaks.
Tactically, a swift reversal atop the 50-day moving average would mark a step toward stabilization.
Looking elsewhere, the Dow industrials’ backdrop remains comparably straightforward.
The blue-chip benchmark has registered a bullish two standard deviation breakout, encompassing three straight closes atop the 20-day Bollinger bands.
Tactically, consecutive closes atop the bands signal a near-term extended posture — due at least a sideways chopping-around phase, if not a deeper pullback — against a firmly-bullish longer-term backdrop.
As reference, see the decisive early-March breakout — flattish pullback — and subsequent upside follow-through.
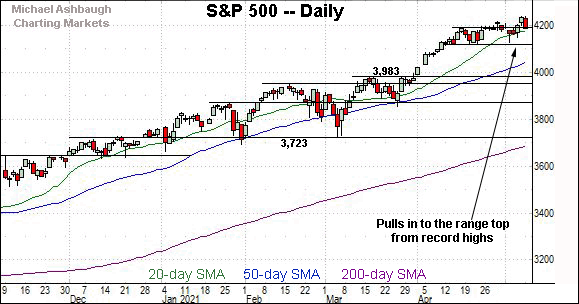
Meanwhile, the S&P 500 has pulled in to its former range to punctuate a less-decisive May breakout.
Tactically, the S&P’s range bottom (4,118) remains its first notable floor.
The bigger picture
As detailed above, the major U.S. benchmarks continue to diverge.
On a headline basis, the S&P 500 and Dow industrials have reversed from recent record highs, pressured amid a downturn that has inflicted limited damage in the broad sweep.
Meanwhile, the Nasdaq Composite has violated its 50-day moving average, pressured amid shaky May price action. (Recall the early-May gap lower, failed test of gap resistance, and subsequent downside follow-through.)
The Nasdaq’s prevailing backdrop supports a bearish bias, pending repairs.
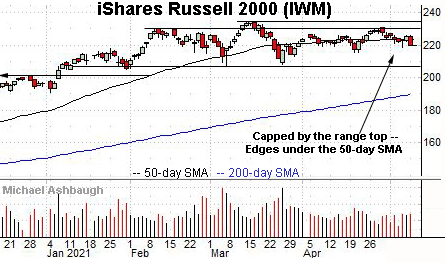
Moving to the small-caps, the iShares Russell 2000 ETF remains range-bound.
Within the range, the small-cap benchmark has ventured back under its 50-day moving average, currently 223.18.
Tactically, the April range bottom (215.24) marks a deeper floor.
Meanwhile, the SPDR S&P MidCap 400 remains comparably stronger.
The MDY has thus far maintained its breakout point, circa 489.50, an area followed by the ascending 50-day moving average, currently 483.48.
Placing a finer point on the S&P 500, the index has reversed respectably from recent record highs.
Tactically, the May low (4,128) is closely followed by the firmer range bottom (4,118).
More broadly, the S&P’s range bottom (4,118) is followed by a less-charted patch — a potential air pocket — and the 50-day moving average, currently 4,045.
(On a granular note, the S&P’s former projected target (4,085) remains an inflection point within the air pocket.)
Delving deeper, the breakout point (3,983) remains the S&P’s first significant support.
As always, it’s not just what the benchmarks do, it’s how they do it. But broadly speaking, the S&P 500’s backdrop supports a bullish intermediate-term bias barring a violation of the 3,980 area.
Tuesday’s Watch List — Charting the U.S. sector backdrop
Drilling down further, the U.S. sub-sector backdrop has softened in spots, but on balance, it continues to support a bullish bias. At least based on today’s backdrop.
Quickly consider the traditional sector leaders — the transports, financials and technology sector:
To start, the Invesco QQQ Trust tracks the Nasdaq 100 Index and offers a proxy for large-cap technology.
As illustrated, the shares have pulled in to important support from recent record highs.
The specific area spans from 324.30 to 325.88, levels matching the breakout point and the 50-day moving average, respectively.
Tactically, a closing violation of this area would raise an intermediate-term caution flag. The prevailing retest — across potentially the next several sessions — will likely add color.
Delving deeper, the ascending 200-day moving average, currently 303.12, is closely followed by the March closing low (299.94).
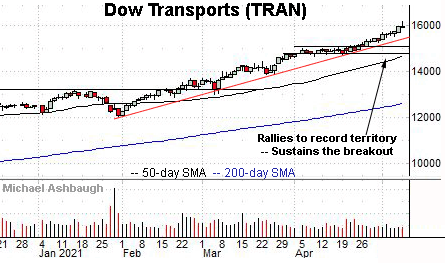
Meanwhile, the Dow Jones Transportation Index remains strikingly resilient.
To be sure, the group is near-term extended — and up on a stilt — following a strong first-half rally. From the Jan. low (12,065) to Monday’s session high (16,170) the transports had rallied 4,105 points, or 34.0%, across about 14 weeks.
A consolidation phase seems to be due amid the prevailing rally’s unsustainable pace.
Still, the prevailing technical backdrop also signals a firmly-grounded uptrend.
Tactically, trendline support is followed by the mid-April breakout point (15,080). A sustained posture atop this area signals a bullish intermediate-term bias.
Similarly, the Financial Select Sector SPDR has taken flight.
Here again, the group’s first-half gain is striking. From the Jan. low (28.82) to Monday’s session high (38.26) the financials had rallied 32.8% across about 14 weeks.
Against this backdrop, the group’s prevailing technicals remain bullish.
Tactically, trendline support is closely followed by the breakout point (35.50) and the ascending the 50-day moving average, currently 34.98. The prevailing uptrend is intact barring a violation.
Charting a stray note — Biotech violates 200-day average
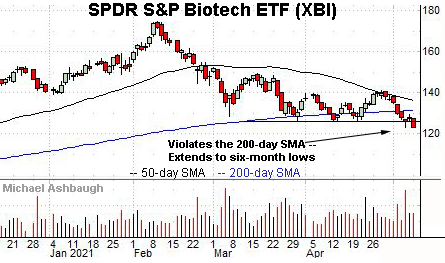
Concluding on a negative note, the SPDR S&P Biotech ETF has registered bearish first-half price action, pressured amid the re-opening trade.
Technically, the group violated its 200-day moving average to start May, and has subsequently extended to six-month lows.
The prevailing downturn punctuates a failed test of the 50-day moving average from underneath.
Tactically, a swift reversal atop the breakdown point (125.90), and the major moving averages, would place the group on firmer technical ground.
More broadly, notice the pending death cross — or bearish 50-day/200-day moving average crossover — signaling that the intermediate-term downtrend has overtaken the primary trend.


