Charting bullish follow-through: S&P 500, Nasdaq extend technical breakouts
Dovish-leaning Federal Reserve policy remarks fuel late-week market surge
U.S. stocks are firmly higher early Friday, rising after dovish-leaning Federal Reserve policy remarks.
Against this backdrop, the S&P 500 and Nasdaq Composite are vying to extend rallies atop their latest round-number milestones — S&P 4,500 and Nasdaq 15,000.
Editor’s Note: As always, updates can be directly accessed at chartingmarkets.substack.com.
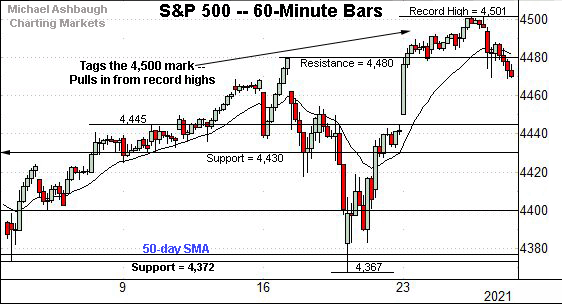
Before detailing the U.S. markets’ wider view, the S&P 500’s hourly chart highlights the past four weeks.
As illustrated, the S&P is digesting its latest rally to record highs. The week-to-date peak has registered just atop the 4,500 mark.
Slightly more broadly, the S&P’s late-August spike punctuates a bullish reversal from the one-month range bottom (4,372).
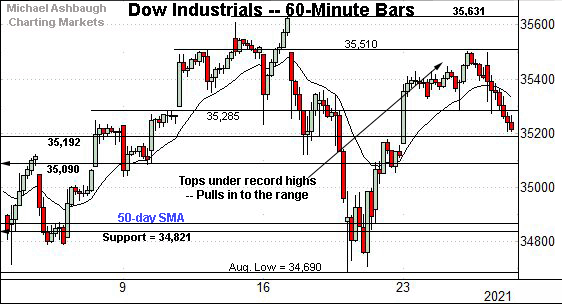
Meanwhile, the Dow Jones Industrial Average has not tagged a new record high.
In its case, the week-to-date peak (35,498) has registered slightly under near-term resistance (35,510).
Conversely, the prevailing upturn punctuates a successful test of the 50-day moving average, currently 34,841, an area also detailed on the daily chart.
Against this backdrop, the Nasdaq Composite is digesting the most decisive technical breakout of the major U.S. benchmarks.
From current levels, the breakout point (14,896) remains the Nasdaq’s first notable support.
More broadly, the aggressive rally originates from one-month lows, established just last week.
Widening the view to six months adds perspective.
On this wider view, the Nasdaq has knifed to tag the 15,000 mark for the first time on record.
The week-to-date peak (15,059) punctuates a 127% rally from the 2020 low (6,631), a level registered amid the worst of the pandemic.
On further strength, a near-term target projects from the August range to the 15,370 area.
Also recall that an intermediate-term target projects to the 15,420 area, detailed repeatedly.
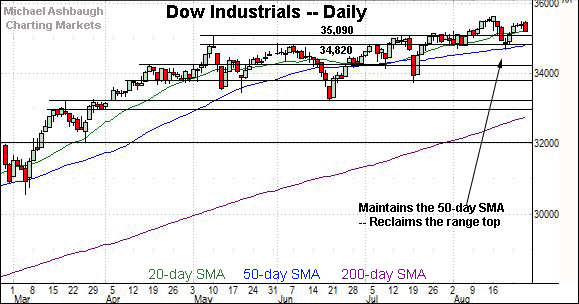
Looking elsewhere, the Dow Jones Industrial Average has not tagged new record highs.
Still, the index has sustained a bullish reversal above its range top (35,090). Constructive price action.
The prevailing upturn punctuates a successful test of the 50-day moving average.
More broadly, the August peak (35,631) — also the Dow’s record peak — has registered about 95% above the 2020 low (18,213).
Meanwhile, the S&P 500 has tagged the 4,500 mark for the first time on record.
In its case, the August peak (4,501) punctuates a 105% rally from the 2020 low (2,191), a level also established amid the worst of the pandemic.
The bigger picture
As detailed above, the major U.S. benchmarks are acting well technically.
On a headline basis, the S&P 500 and Nasdaq Composite have tagged round-number milestones this week — S&P 4,500 and Nasdaq 15,000 — for the first time on record.
Meanwhile, the Dow Jones Industrial Average has not yet tagged record highs amid the markets’ latest shift toward growth and away from value.
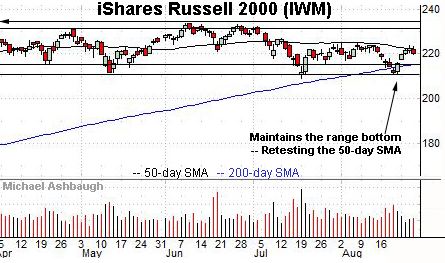
Moving to the small-caps, the iShares Russell 2000 ETF remains range-bound.
Within the range, an extended test of the 50-day moving average, currently 222.28, remains underway. The 50-day has effectively capped the small-cap benchmark since mid-July.
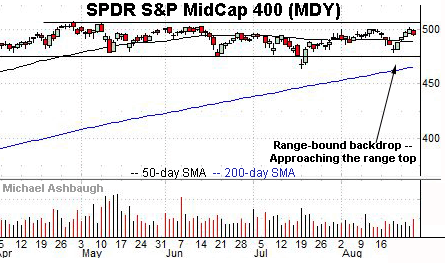
Meanwhile, the SPDR S&P MidCap 400 ETF remains comparably stronger.
Recall the prevailing upturn places the MDY’s record high (507.63), established April 29, within striking distance.
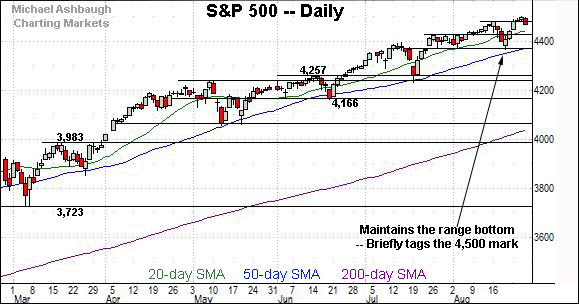
Placing a finer point on the S&P 500, the index is vying Friday to register its first close atop the 4,500 mark.
The prevailing upturn punctuates a second successful August test of the range bottom (4,372).
More broadly, the S&P 500 continues to trend steadily higher. (Notice the relatively steep slope of the 200-day moving average, tracking a trajectory similar to that of the 50-day moving average.)
Amid the uptrend, recall the sharp August reversal from one-month lows resembles the aggressive mid-July rally from one-month lows.
Both rallies originated from one-month lows closely matching notable support — the 4,257 and 4,372 areas. (Also see the hourly chart.)
Tactically, the 50-day moving average, currently 4,377, is closely followed by major support (4,372). A sustained posture atop this area signals a comfortably bullish intermediate-term bias.
Conversely, upside targets continue to project to the 4,510 and 4,553 areas, detailed previously. Friday’s early session high (4,505) has registered within view. The weekly close may add color.
No new setups today. Back in action Monday.


