Charting the approach of S&P 4,500 as Nasdaq tags the 15,000 mark
Focus: Health care sector sustains break to record territory, XLV, CSCO, MDT, FIVE, HLIT
U.S. stocks are slightly higher early Wednesday, largely treading water ahead of the Federal Reserve’s virtual meeting, later this week.
Against this backdrop, the S&P 500 is approaching the 4,500 mark, while the Nasdaq Composite vies to extend its first-ever break atop the marquee 15,000 mark.
Editor’s Note: As always, updates can be directly accessed at chartingmarkets.substack.com.
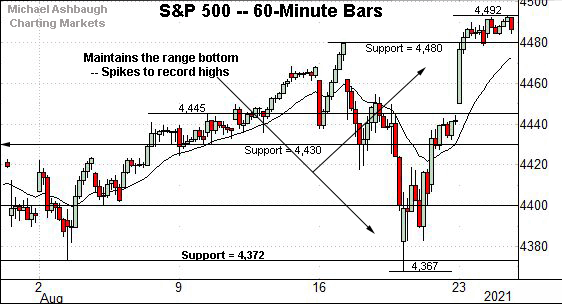
Before detailing the U.S. markets’ wider view, the S&P 500’s hourly chart highlights the past four weeks.
As illustrated, the S&P has knifed to its latest record high.
The slight breakout punctuates a bullish reversal from the one-month range bottom (4,372).
From current levels, the breakout point (4,480) pivots to support.
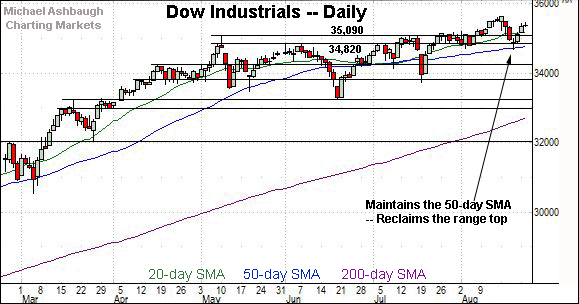
Meanwhile, the Dow Jones Industrial Average has not broken out.
Still, the index has rallied respectably from its one-month range bottom.
Recall the prevailing upturn punctuates a successful test of the 50-day moving average, currently 34,786, an area also detailed on the daily chart.
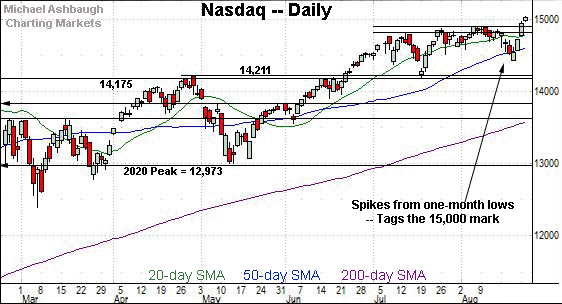
Against this backdrop, the Nasdaq Composite has staged the most decisive technical breakout.
The bullish reversal punctuates last week’s brief whipsaw below the 50-day moving average, currently 14,615. (The 50-day matches support.)
Tactically, the breakout point (14,896) pivots to first support.
Widening the view to six months adds perspective.
On this wider view, the Nasdaq has knifed to record highs, rising to tag the 15,000 mark.
The prevailing upturn punctuates a jagged test of the 50-day moving average.
Tactically, a near-term target projects from the August range to the 15,370 area.
Slightly more broadly, an intermediate-term target continues to project to the 15,420 area, detailed previously. (See for instance, the July 26 review.)
Looking elsewhere, the Dow Jones Industrial Average has not yet tagged new record highs.
Nonetheless, the index has reclaimed its range top (35,090), rising from a successful test of the 50-day moving average. Constructive price action.
Meanwhile, the S&P 500 has tagged a nominal record high.
The marquee 4,500 mark is firmly within view.
Tuesday’s session high (4,492.81) and Wednesday’s early session high (4,492.82) registered within striking distance of the 4,500 mark.
The bigger picture
As detailed above, the major U.S. benchmarks continue to trend higher.
On a headline basis, S&P 500 and Nasdaq Composite have tagged record highs, rising sharply from one-month lows established just Thursday.
The bullish reversal resembles the aggressive mid-July spike from one-month lows, an area then matching major support. (See for instance, the July 26 review.)
Moving to the small-caps, the iShares Russell 2000 ETF remains range-bound.
The prevailing upturn punctuates a jagged test of the 200-day moving average, as well as a prolonged five-month range bottom.
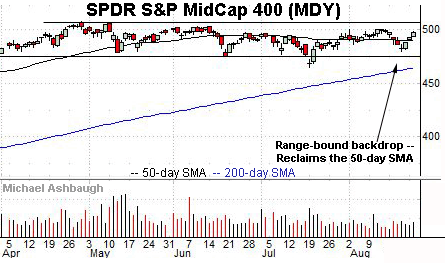
True to recent form, the SPDR S&P MidCap 400 ETF remains comparably stronger than the small-caps.
Though still range-bound, the prevailing upturn places the MDY’s record high (507.63), established April 29, within striking distance.
Placing a finer point on the S&P 500, the index has knifed to record territory.
The prevailing upturn punctuates a second successful test of the range bottom (4,372).
Last week’s low (4,367) — also the August low — registered nearby.
More immediately, the prevailing flag pattern signals still muted selling pressure near record highs.
Returning to the S&P 500’s six-month view, the index continues to trend higher.
Tactically, the 50-day moving average, currently 4,367, is rising toward familiar support (4,372).
On further strength, upside targets continue to project to the 4,510 and 4,553 areas, detailed previously. (See the July 26 review.)
Separately, a slightly more distant target projects from the August range to the 4,590 area.
Beyond technical levels, the S&P 500’s intermediate-term bias remains bullish as it vies to confirm its primary uptrend with more decisive follow-through.
Editor’s Note: The next review will be published Friday.
Watch List
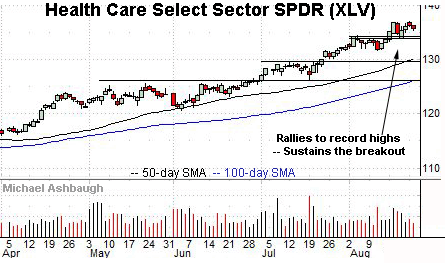
Drilling down further, the Health Care Select Sector SPDR is acting well technically. (Yield = 1.4%.)
As illustrated, the group has asserted a flag pattern, digesting the mid-August strong-volume rally to record territory.
Tactically, the breakout point (134.20) is followed by the former range bottom (131.70) and the ascending 50-day moving average, currently 130.20. The group has trended atop the 50-day since March, and a sustained posture higher signals a bullish bias.
Cisco Systems, Inc. is a large-cap name taking flight. (Yield = 2.5%.)
Technically, the shares have knifed to record highs, staging an unusual two standard deviation breakout after the company’s strong quarterly results.
Though near-term extended, and due to consolidate, the shares are attractive on a pullback. Tactically, trendline support is rising toward the breakout point (55.60).
More broadly, the shares are well positioned on the five-year chart, clearing an inflection point matching the 2019 peak (58.26).
Medtronic is a well positioned large-cap medical device manufacturer. (Yield = 2.0%.)
As illustrated, the shares have rallied to the range top, rising to tag record highs after the company’s first-quarter results.
The prevailing upturn punctuates a prolonged four-month range — and has been fueled by a volume spike — laying the groundwork for potentially material follow-through.
Separately, notice the cup-and-handle defined by the June and August lows. A near-term target projects to the 140 area.
Five Below, Inc. is a well positioned large-cap specialty retailer.
Technically, the shares have staged a bull-flag breakout, rising to record territory.
The prevailing upturn positions the shares to build on the early-August strong-volume spike. Tactically, a sustained posture atop the breakout point (228.50) signals a firmly-bullish bias.
Note the company’s quarterly results are due out Sept. 1.
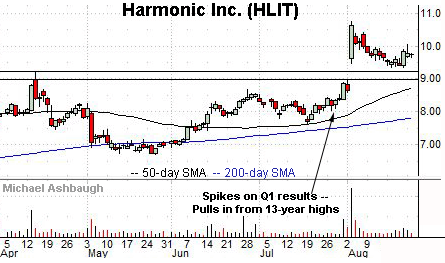
Finally, Harmonic, Inc. is a small-cap developer of telecommunications and video-delivery solutions.
Earlier this month, the shares knifed to 13-year highs, rising after the company’s first-quarter results.
The subsequent pullback has been fueled by decreased volume, placing the shares 10.5% under the August peak.
Tactically, the post-breakout low (9.34) is followed by the breakout point (8.95). A sustained posture higher signals a bullish bias.
Editor’s Note: The next review will be published Friday.


